IR Information > Financial Highlights
Fiscal years ended March 31, 2010 to 2014
(million yen)
| FY3/2010 | FY3/2011 | FY3/2012 | FY3/2013 | FY3/2014 | |
|---|---|---|---|---|---|
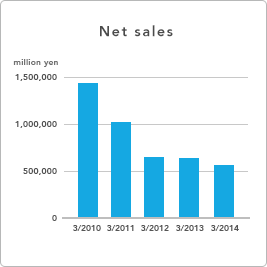
| Net sales | 1,434,365 | 1,014,345 | 647,652 | 635,422 | 571,726 |
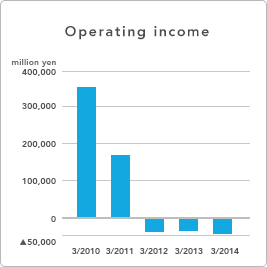
| Operating income | 356,567 | 171,076 | -37,320 | -36,410 | -46,425 |
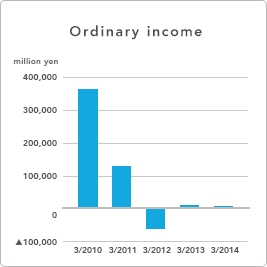
| Ordinary income | 364,324 | 128,101 | -60,863 | 10,482 | 6,086 |
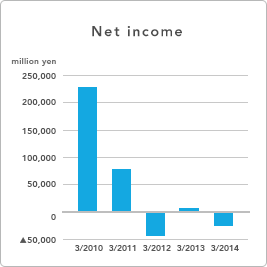
| Net income | 228,635 | 77,621 | -43,204 | 7,099 | -23,222 |
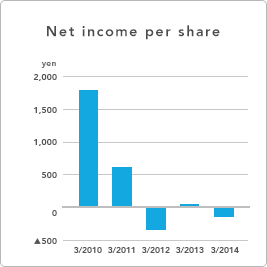
| Net income per share (yen) | 1,787.84 | 606.99 | -337.86 | 55.52 | -183.59 |
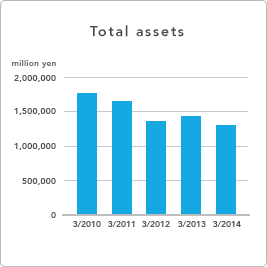
| Total assets | 1,760,986 | 1,634,297 | 1,368,401 | 1,447,878 | 1,306,410 |
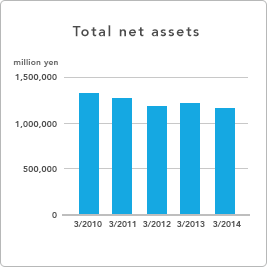
| Total net assets | 1,336,585 | 1,281,861 | 1,191,025 | 1,227,520 | 1,118,438 |
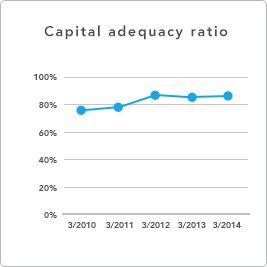
| Capital adequacy ratio | 75.9% | 78.4% | 87.0% | 84.8% | 85.6% |
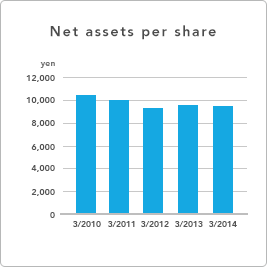
| Net assets per share (yen) | 10,450.33 | 10,022.26 | 9,313.15 | 9,598.22 | 9,447.00 |
[Note] Net income per share is calculated using the average number of outstanding shares for the fiscal year (excluding treasury stock). Also, net assets per share is calculated using the number of outstanding shares as of the end of the fiscal year (excluding treasury stock).
