Semi-Annual Financial Results Briefing
for the 68th Fiscal Term Ended March 2008
Oct. 26, 2007 Satoru Iwata, President

Thank you very much for joining our Operational Briefing despite your busy schedules and the bad weather. I’m Satoru Iwata, president of Nintendo.
Today, I would like to first explain the general outline of our mid-term financial results that we announced yesterday. And then, I would like to further explain the current situations in Europe and in the U.S., and also about our future prospects. After my presentation, we will welcome your questions. Thank you for your cooperation.
Let me explain the gist of our mid-term results.
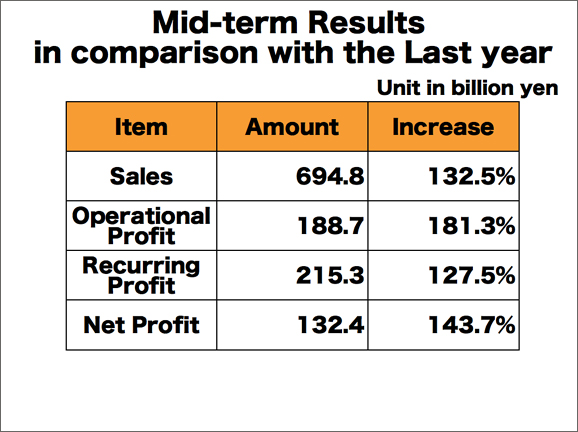
Let’s look at the mid-term results in comparison with the corresponding numbers one year ago. The sales were 694.8billion yen, up 132.5% from the previous year. We had not launched Wii a year ago, and DS Lite had a limited contribution last year as it was launched in the overseas market in June 2006. On the other hand, for the most recent half-year, sales of both Wii and DS Lite are reflected all through the 6 months to create a significant increase.
The operational profit was up 181.3% to 188.7billion yen. The rate of increase is higher for the operational profit than for sales mainly because of a decreased percentage of fixed costs for sales. Recurring profit was 215.3billion yen, up 127.5% from the previous term. Thanks mainly to the increase of the recurring profit, the net profit was also up 143.7% to become 132.4billion yen.
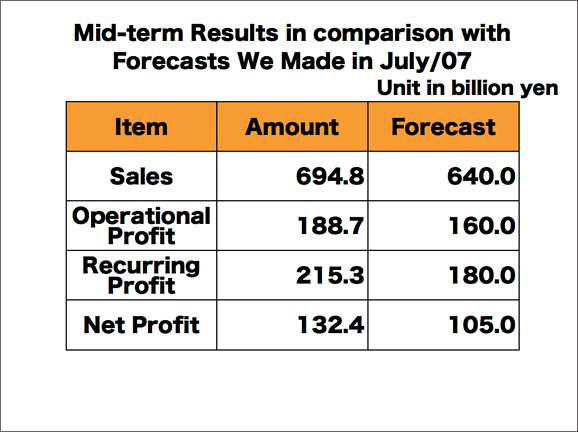
I’d like to compare the mid-term results with the forecasts we made in July this year. While we had estimated in July that the sales would be 640billion yen, the actual result was 694.8billion yen. We forecasted operational profit to be 160billion yen but the actual result increased to 188.7billion yen. Thanks to the increased operational profit, the recurring profit was also up from the estimated 180billion yen to 215.3billion yen. As a result, the net profit was up from the estimated 105billion yen to 132.4billion yen.
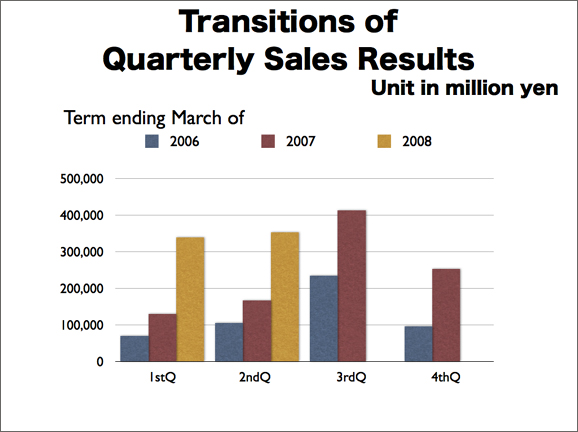
You are looking at quarterly results over the past two years. As you can see, the majority of sales have been realized in the 3rd quarters, normal for the video game business, as they include the holiday sales season. The sales decrease was small in the 4th quarter of the last fiscal year, because of the fact that both Nintendo DS and Wii were maintaining steady sales globally, which is actually an exception in this industry’s history.
However, in the 1st and 2nd quarters of this fiscal year, we were able to record a level of sales which could be compared with that in peak sales seasons in the past. It was obvious that the sales of Wii hardware and software made a great contribution. In fact, with the expansion of the gaming population, video games, which were bought mainly as gifts during the year-end sales seasons in the past, are now being purchased by adults who can afford to buy their games anytime they like. In other words, the so-called seasonality factor in determining demand has become smaller.
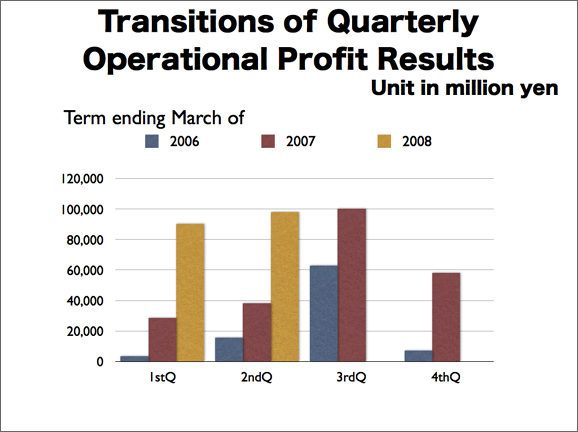
In accordance with increased sales, operational profit also increased in comparison with the last two years.
We believe this kind of expansion in our operations is the result of our endeavors over the last 4 years or so of.

Expanding the Gaming Population.
Having said that, however, it’s true our efforts did not bear immediate results. Especially when we look around the world, changes occur in each region at different rates.
As I made rather detailed explanations about the Japanese market at the Nintendo Conference 2007 that we held on October 10, I’d like to mainly talk about the sales in the overseas markets, especially the United States and Europe.
But, before talking about the overseas markets, there is just one thing I’d like to report to you on the Japanese market. That is, as of this week, cumulative Nintendo DS shipments topped 20 million units. In the past, it was believed that a 20million units installed base was the upper limit for any game machine to be sold in this country, but we would like to accelerate the sales trend so that there is not just one Nintendo DS in a household, but that each member of a household is tempted to buy it.
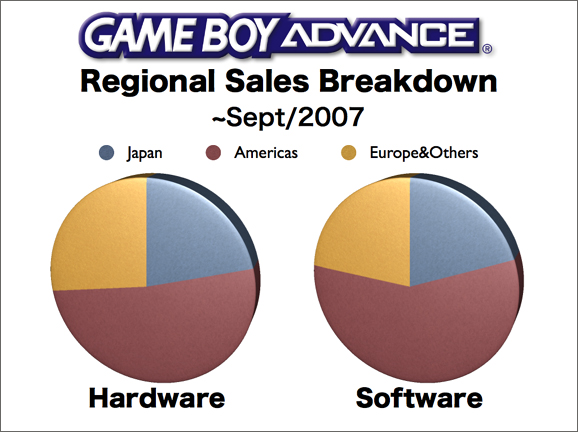
Based upon the numbers that we have disclosed during past financial announcements, these charts show regional sales breakdowns for Game Boy Advance, a hardware system of which we have shipped 80.48million units since launch. As you can see, more than half of the sales were made in the Americas, while the remainder was almost equally shared between Japan and Europe. When we compare sales in Japan, the Americas and Europe, the ratio of 1 to 2 to 1 was a typical regional breakdown for Nintendo platforms in the past.