for Fiscal Year Ended March 2010
May 7, 2010 Presentation by Satoru Iwata, President

Next, I’d like to talk about our financial forecasts for the current term ending March 2011.

As for the unit shipment forecast for the major hardware and software:
We are expecting Nintendo DS hardware shipment to be 30 million units and the software shipment to be 150 million units. The forecasts include the sales of Nintendo 3DS which we will launch during this fiscal year.
As for Wii, we are expecting to ship 18 million hardware and 165 million software. Here, please note that the actual results of the 70th term that you are seeing to your right on the chart include the software which were bundled with the hardware, but the forecasts for the 71st term to your left do not include the bundled software. So, when we consider the software to be sold together with the hardware, we’re actually expecting our Wii software sales in the current fiscal year to outnumber that in one year ago.

Based on these unit sales forecasts, we are expecting our Net Sales to become 1 trillion 400 billion yen and Operating Income to be 320 billion yen for the current fiscal year. As we base our forecasts in the foreign currency exchange rates of 95 yen per US dollar and 120 yen per euro, we expect our Ordinary Income to be 320 billion yen and Net Income to be 200 billion yen.

Lastly, I’d like to update you on the gaming population survey that the company is conducting periodically.

I showed this graph of Japanese gaming population transitions in the last Financial Briefing we held in January this year.
As I have explained to you sometimes in the past, since May 2005, Nintendo has been conducting interview surveys twice a year with approximately 3000 people in Tokyo and Osaka in order to investigate the progress of the gaming population expansion. The Active Users described in blue in this graph are the people who have played with a home console video game machine or a handheld video game device that they or their families own at least one time in a year. The Sleep Users in yellow are those who used to play but have not played in the last year. The pink Non-Users are those who have never played with a video game. Please note that since May 2006, we have been interviewing people from 7 to 74 years old. However, in this graph, we are showing the transition of gaming population between 7 to 64 years old in order to make a consistent comparison since 2005.
In Japan, the gaming population once hit the temporary ceiling shortly after the 2007 year-end sales season, from which the gaming population appeared to be declining. However, the recovery was made at the end of last year. When you look only at this chart, you may feel that gaming population expansion may be hitting its limit.
Quite recently, the result of our survey we conducted from January to March this year in the U.S. has just been reported to me. I’d like to show you the situation in comparison to the U.S.
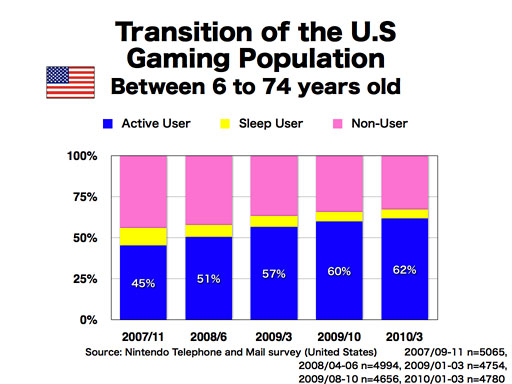
This chart shows the transition of the gaming population expansion in the U.S.
Unlike in Japan, we have been conducting the survey to people from 6 to 74 years old from the beginning, so please note that this graph covers a wider age demographic than that for Japan. As you can see, the ratio of the gaming population further increased. The 62% of the total population is the highest of all of our surveys so far. Let’s break down the players of Nintendo DS and Wii by different colors.

It looks like this. It is obvious that Wii and Nintendo DS have been playing central roles in leading the U.S. gaming population expansion. Also notable is that there are still many people who are starting to play video games. Further, unlike in Japan, there is the smaller percentage of players who stop playing video games.
I think this graph shows one reason why the U.S. video game market has been growing larger than the Japanese one when we compare the both markets by taking into considerations the ratios of the populations in mind. It also reminds us that there still are the things Nintendo can do in order to further expand the gaming population.
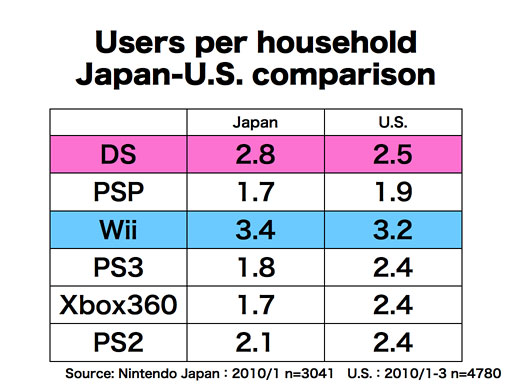
We have stated that we make much of this user per household index as an important indicator for looking into the mid-term future. When we see the general trend, both Wii and Nintendo DS were able to keep the high numbers in the most recent surveys in Japan and in the U.S. while the number is showing a downward trend for other companies’ platforms.
Some people who have been analyzing the video game business appear to rely on the past business transitions in order to forecast future development, and many tend to see a video game platform with a product lifecycle of 5 years or longer. However, times have changed and how our consumers react has also changed. For Wii and Nintendo DS, our customer base has shown unprecedented change and been enlarged with the gaming population expansion. Accordingly, we believe they do not follow the lifecycle patterns of the past platforms.
We believe there is still further room for gaming population expansion.
Be it Nintendo 3DS that will be shown at E3 this year, new software lineup for this year and our efforts to promote and market our hardware and long tail software to those who have not played Nintendo DS nor Wii yet, they are all connected to our basic strategy of gaming population expansion. Nintendo will not stop its endeavors to carry out what we believe is the most important mission in the entertainment business, which is to “surprise people in meaningful ways through our products.”

Thank you for listening.