for Fiscal Year Ending March 2011
Jan. 28, 2011
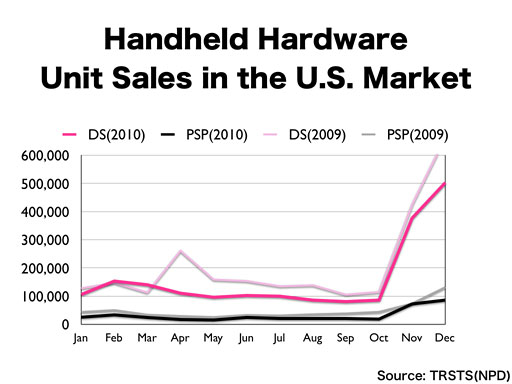
We converted the monthly sales data issued by NPD into the weekly sales to show how the handheld game devices are selling in the U.S. every month.
In the year-end sales season of 2010, Nintendo DS increased its sales. The December sales of 2.5 million units were not bad at all in terms of the fact that the launch of Nintendo 3DS was anticipated. However, it could not reach the December 2009 level when Nintendo DS was able to sell a significant number, 3.3 million units to be more exact.
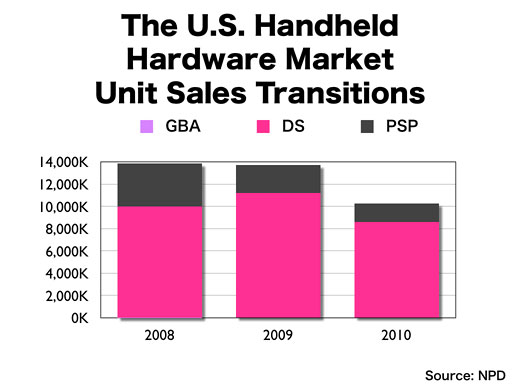
This graph shows the transitions of the handheld hardware unit sales in the U.S.
While the entire handheld hardware sales showed a decline over the 2009 level, Nintendo DS increased its market share from 82% in 2009 to 84% in 2010.
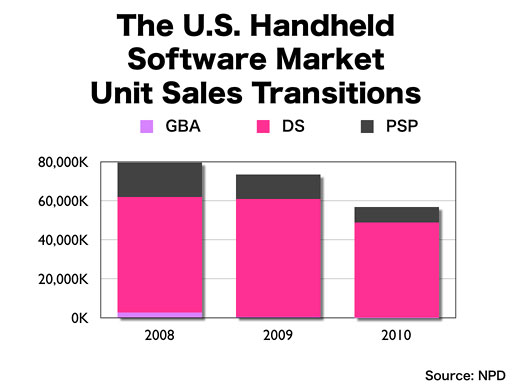
On the other hand, this chart compares the handheld software unit sales transitions in the U.S. market.
Like the hardware, fewer units than 2009 were sold.
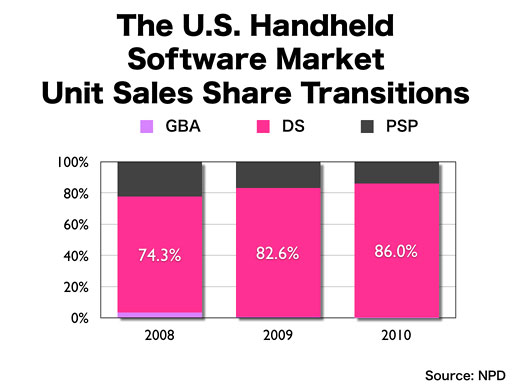
On the other hand, when we focus upon the market share within the handheld software market, Nintendo DS further increased its share.
Of course, since the unit sales have decreased, we cannot afford to be content with this increased market share at all. But at least, you will be able to understand that the U.S. market is completely different from the Japanese market.
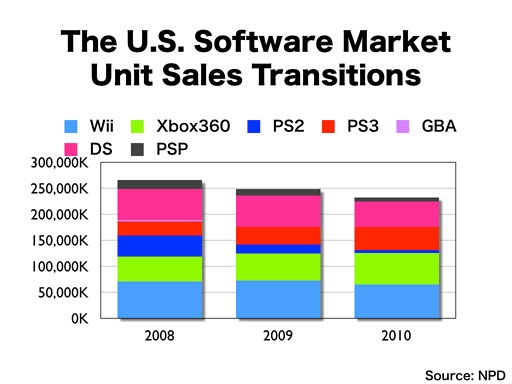
When we look at the entire U.S. software market, due to the decrease in handheld software sales, the software unit sales decreased two calendar years in a row.
Comparing it with the Japanese situation, you will notice that the ratio of home console software sales and those of handheld software largely diverge, and that the entire software market in the U.S. is far bigger than the market in Japan.
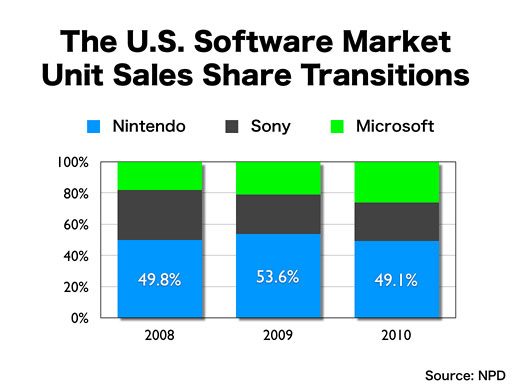
As we look at the U.S. software market's unit sales share transitions by the three hardware manufacturers, in spite of the fact that Nintendo decreased its market share when compared with 2009, it may be a bit of a surprise to know that its share did not largely change from the level of 2008, when the entire market was enjoying rather healthy sales, although the unit sales of 2010 were less than those of 2008.
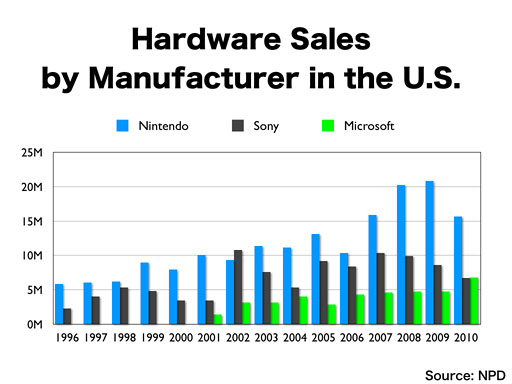
Let’s see the U.S. market from a more macro trend perspective. I showed this chart at our Corporate Management Policy Briefing in October 2010. Based on NPD data, we have compiled this graph, which shows how many hardware units were sold by each platform holder in each calendar year, starting from 1996, when Nintendo launched Nintendo 64.
I said at that time that in the three consecutive years of 2007, 2008 and 2009, the hardware sales of Nintendo platforms reached record levels. In 2010, the unit sales of Nintendo's Wii and Nintendo DS platforms combined exceeded 15 million, which was almost equal to the unit sales level in 2007, and 2.3 times as much as the other two platform holders. In 2010, for the first time, Microsoft outsold Sony in the hardware unit sales with a slight margin.
When it comes to the question of whether we should focus only upon Nintendo's own year-on-year comparisons or think also in terms of Nintendo's presence in the entire market, I think the latter is a more well-balanced approach, and I am hopeful that you will take that stance.

Finally, I would like to discuss the European market.
Europe is a cluster of countries with many different characteristics, and because consolidated data like that of NPD is not collected in this region, it can be difficult to understand the actual situation.
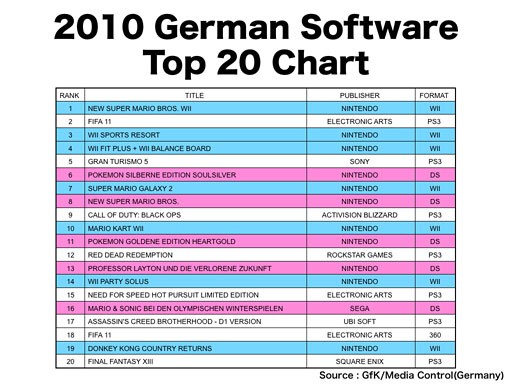
First of all, although doing so may sound a bit too detailed, I would like to introduce the hit sales charts of the European market by country. This chart shows the 20 best-selling software titles in Germany for 2010.
As you can see, there are 12 titles for Nintendo platforms. We should also note the fact that many Nintendo DS titles feature in this chart. In addition, except for in the U.K., Xbox 360 has a weak presence throughout Europe. In contrast to the U.S., most of the PS3 versions of multi-platform software are ranked higher than the corresponding versions of Xbox 360.
One difference from the U.S. is that FPS (First Person Shooter) war games are not ranked highly in Germany because there is a cultural resistance to that type of game. As for Nintendo platforms, software titles released last year or earlier are ranked in rather high positions because it generally takes time for new software to be accepted in the German market. Other differences include the inclusion of the Nintendo DS software "Mario & Sonic at the Olympic Winter Games" in this chart and, even though neither "Wii Party" nor the third iteration of "Professor Layton" series were featured in the U.S. chart, both titles can be seen here.
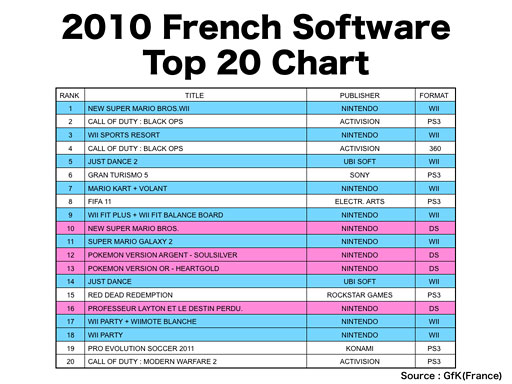
This is the corresponding chart for France.
There are many titles for Nintendo platforms included, 13 to be more specific. Two titles published by Ubisoft, "JUST DANCE" and "JUST DANCE 2" are within the chart in France, where Ubisoft’s headquarters are located.
Like in Germany, Xbox 360 titles have a weak presence.