for Fiscal Year Ending March 2012
Oct. 28, 2011
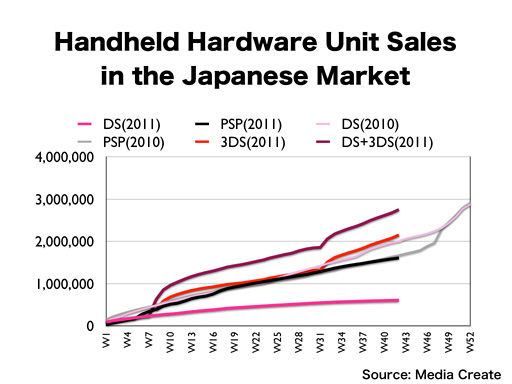
Looking at the transition of the total sales over the year, the sales volume of the Nintendo DS has largely decreased, but the sales pace of Nintendo 3DS has been accelerating since the markdown. As a result, when we add the number of units of the Nintendo DS and the Nintendo 3DS together, and look at Nintendo’s handheld hardware unit sales as a whole, you can see that our sales transition is highly exceeding the level of last year.
At the end of this year, big titles for the Nintendo 3DS will be released in a density previously unheard of, so we would like to make a spurt and invigorate the market.

Next, about the United States.
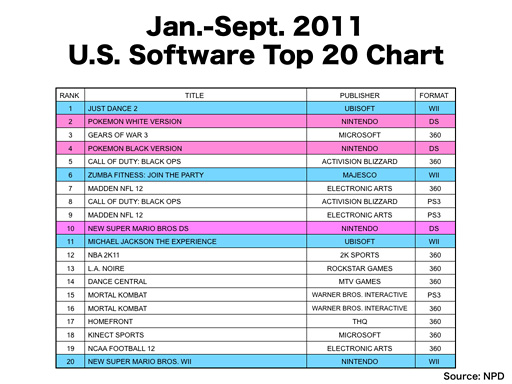
This chart shows the 20 best-selling software titles in the U.S. from January through September of 2011. Seven titles from Nintendo platforms are included, but unlike in the previous years, three Wii titles, which are ranked high in the chart, were not released by Nintendo but from other software publishers. As I talked in the Financial Results Briefing in April, dancing titles are surging ahead, and the top three titles for Wii are dancing games. Other than these three titles, “Dance Central” for Xbox 360’s Kinect is also included in the chart, which means that four out of the 20 top-selling titles are dancing games. On the other hand, “Pokémon Black Version” and “Pokémon White Version,” which were released in September last year in Japan, were launched in the U.S. in March this year, so these titles are high in the ranking. “New Super Mario Bros.” for the Nintendo DS and “New Super Mario Bros. Wii” are continuously keeping their high positions in the ranking. Last year, we could find other evergreen titles for the Wii such as “Wii Fit Plus,” “Wii Sports Resort” and “Mario Kart Wii” in the charts, but these titles are no longer listed in this chart for the U.S.
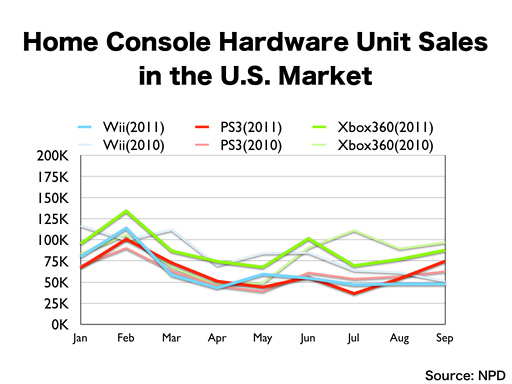
This chart shows the weekly unit sales of the Wii, PS3 and Xbox 360 in the U.S., based on monthly data issued by NPD for January through September of 2010 and 2011. The deep-colored lines indicate this year and the pale lines represent last year. As I have mentioned in the past, this data, from the independent NPD Group, is published only monthly, and the monthly data fluctuates from a four-week month to a five-week month, so in this graph, we are showing the weekly averages.
Compared to the data from last year, it stands out that Xbox 360 is leading the home console market this year. The sales of Wii are weaker than last year, but the figures from September are almost at the same level. The Wii generated massive sales in the year-end sales seasons last year and the year before, but no signs of such phenomenon could be found at this time of those years. At the same time, the start of the year-end shopping season is gradually becoming later every year in the U.S. because of the economic trend and changes in consumer behavior. Therefore, we believe that the extent to which we can maximize the sales of Thanksgiving and the Christmas season will determine our business this year more than before.
According to a report from Nintendo of America, the U.S. sales of the Wii for the first three weeks of October exceeded those of the corresponding period a year ago. They also reported that consumers are reacting favorably to the value promotions offered by the retailers. I think this is a good sign for sales growth in the year-end.
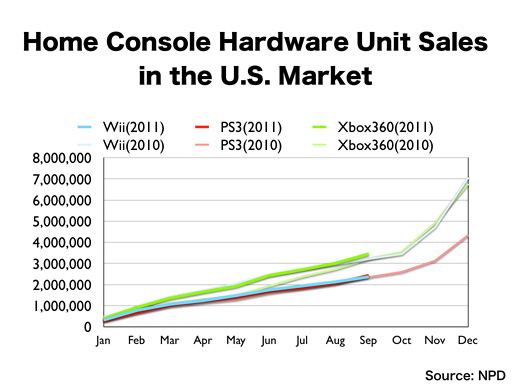
For your information, this chart shows the comparison of the cumulative sales transitions of last year and this year. As you can see, the sales of Wii grew especially in November and December last year.
We assume that our dependence on the year-end sales will be heavier this year than the previous years, so we are currently preparing well so that we can increase our sales in that season.
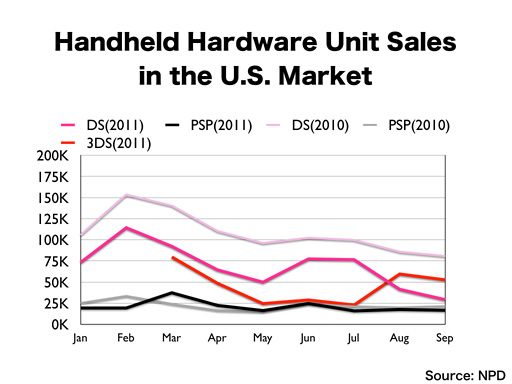
This shows a year-on-year comparison of the weekly sales figures of the Nintendo DS and PSP in each month. The Nintendo DS has decreased compared to last year because the Nintendo 3DS was released in March, but because the transition to the new platform has been slower in the U.S. market compared to that of Japan, a certain market size has been maintained.
This is the sales transition of the Nintendo 3DS, which was released this year. From April through June, the sales level of Nintendo 3DS was substantially below our expectations, but after the markdown in August, it finally overtook the Nintendo DS. On the other hand, the Nintendo DS still has a certain presence in the market.
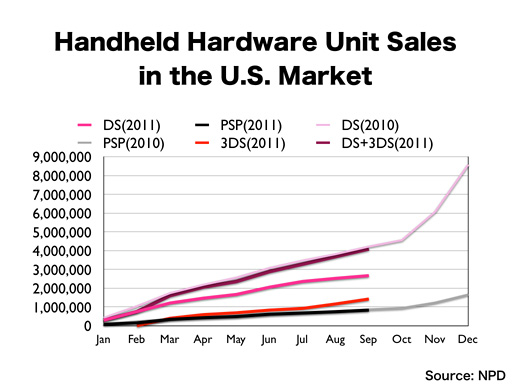
Comparing the cumulative sales transition of this year to that of last year, you can see that the aggregation of the sales of the Nintendo DS and the Nintendo 3DS is very similar to last year’s sales transition of the Nintendo DS. In the U.S. market, Nintendo’s handheld hardware business tends to grow rapidly at the end of the year, and we also have some highly-anticipated titles ready for the Nintendo 3DS, so we would like to largely improve our sales in the year-end.
As is the case with the Wii, consumers have been reacting very positively to the value offers for the Nintendo 3DS that the retailers started from the beginning of October. We are starting to see solid reactions from the market needed for a good year-end sales season.

Finally, let me discuss the situation in Europe.
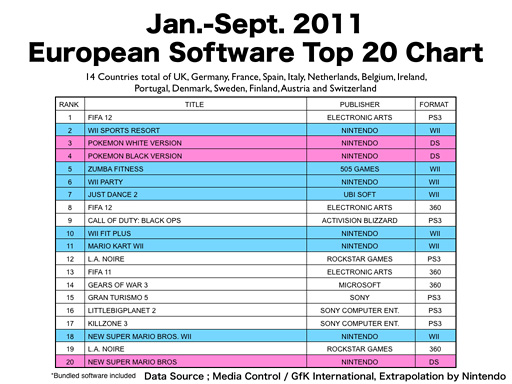
This is the European top 20 chart for the period of January through September this year. The chart reflects the sales of the U.K, Germany, France, Spain, Italy, the Netherlands, Belgium, Ireland, Portugal, Denmark, Sweden, Finland, Austria and Switzerland. The data from each of these countries were collected by local independent research companies, calculated by Nintendo and made into this chart. In Europe, which platform or what kind of software sells well largely differs from country to country, but I would like to talk about the European market as a whole.
Some of you might have the impression that Nintendo platforms have not gained momentum this year, but in this chart, unlike in the U.S. or Japanese markets, many Nintendo titles are listed here, as you can see there are 10 for Nintendo platforms in this chart. You can also find two dancing software titles in this chart, and as a characteristic of Europe, soccer games are very popular. Nintendo 3DS software is not included in this chart, which was also the case in the U.S., since the hardware itself has not spread enough yet.
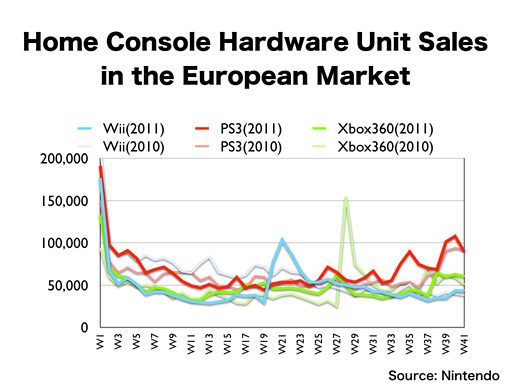
This is the sales of home consoles in the European market. Nintendo gathered the data from independent market research companies in European countries to compile these charts and graphs.
There was a sizable drop in Wii’s sales transition from the beginning of the year, compared to the year before. We were able to stimulate the market by the price revision in May, but recently we have been behind other platforms again.