Third Quarter Financial Results Briefing
for Fiscal Year Ending March 2012
Jan. 27, 2012
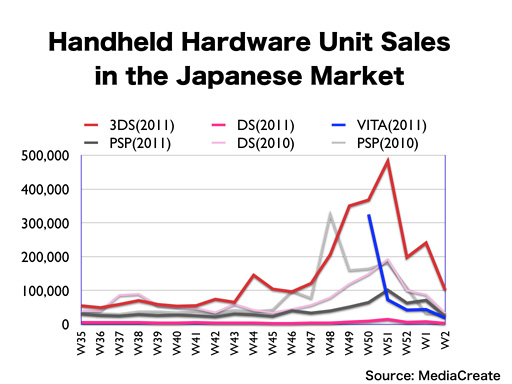
This chart shows the sales transitions of handheld hardware in Japan.
As you can see, similar to what we experienced with the Nintendo DS from the Brain Training boom in late 2005, the Nintendo 3DS enjoyed a large increase late last year with three titles achieving sales of one million units after just ten months from the launch of the hardware, which is the fastest of all time in Japan. If you compare this chart with the chart for the home consoles that I showed you earlier, I think you will see the difference in the increase.
In 2010, since Capcom’s “Monster Hunter Portable 3” for PSP was a massive hit, Sony’s PSP enjoyed high sales, but even if you compare their situation with last year’s performance of the Nintendo 3DS, I think it is obvious that the momentum of the Nintendo 3DS had a dominating presence in the market. From our analysis, we were able to stir excitement in the Japanese market because we sustained market activity by holding on to the momentum after the price cut in August with hot topics provided through the Nintendo 3DS Conference in September and Nintendo Direct in October, and then by continuously releasing big titles from November.
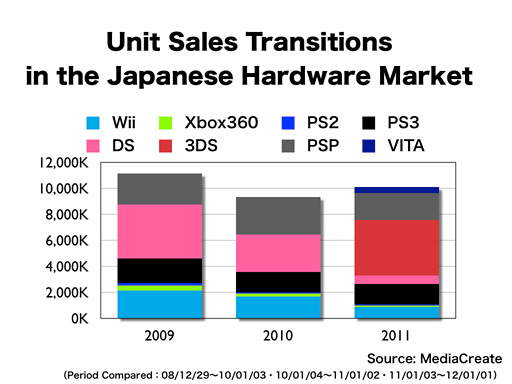
This chart shows the yearly hardware unit sales during the past three years in Japan.
I think you can see how much presence the Nintendo 3DS had last year. In recent years, we had seen a decline in units of hardware sales each year, but last year, with the huge increase late last year for the Nintendo 3DS, we had an increase from the previous year. The Japanese market has a characteristic, which is very unique compared to other markets, where the handheld hardware sales have a very high ratio among the overall hardware sales.
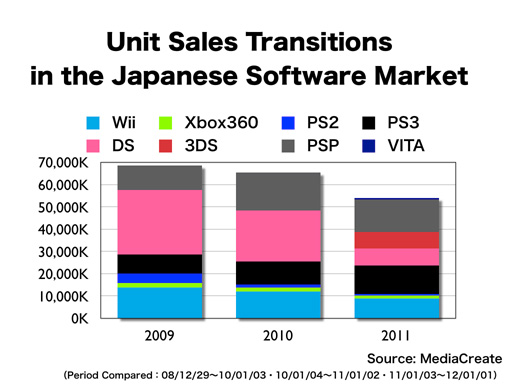
For the software market, there was a large decrease in software sales since we were short on hit titles during the first half of last year. Software sales come behind hardware expansion and until a new hardware sells a certain amount, the software market temporarily shrinks. We were in such transitional phase last year.

Next, the United States.
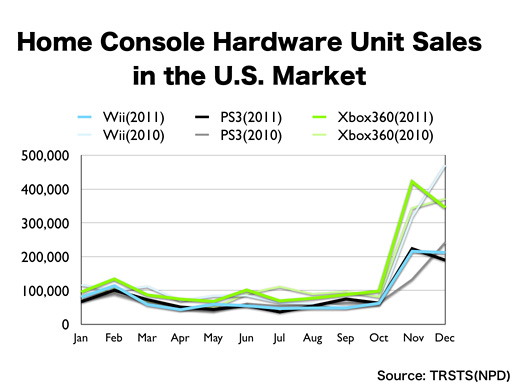
This chart shows the weekly sales of home console hardware in the U.S. As we have confirmed several times in the past, the monthly data from the independent NPD Group in the U.S. fluctuate from a four-week month to a five-week month, so in this graph, we are showing the weekly averages. The dark colors are for 2011 and the light colors are for 2010.
As you can see, Microsoft’s Xbox 360 had large momentum and led the market throughout last year. The Wii and Sony’s PS3 had similar sales throughout the year, but the Wii gained an edge for the total sales. Usually, the Wii enjoys high sales in December, but last year, even though “The Legend of Zelda: Skyward Sword” was highly acclaimed, we were not able to expand it sufficiently to our target audience, and although the Wii was the platform which sold the most software in December, we were not able to propose new Nintendo titles to our broad audience. Therefore, except for Ubisoft’s “JUST DANCE 3” there were no Wii titles with huge sales in the year-end sales season. Along with effects from our trade marketing activities in December which mainly focused on the Nintendo 3DS, we were not able to sell the Wii as well as we usually do.
However, not just the Wii, but the overall performance of home consoles in December was lower than the previous year, and I think that the market is now waiting for a new proposal for home consoles.
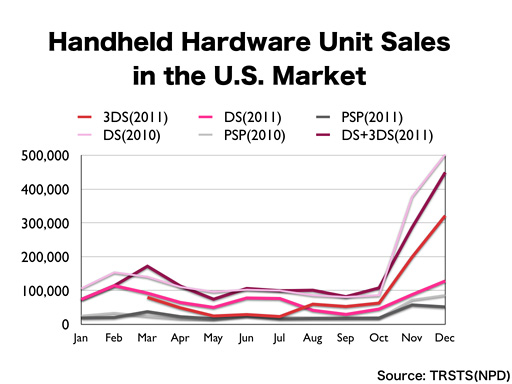
This chart shows the weekly sales of handheld hardware in the U.S.
As I said during the explanation for proliferation speed after launch, the Nintendo 3DS boosted its sales and was at the center of the year-end sales season, even though it had once lost its momentum from May to July. For your information, this line(![]() ) is when you combine the Nintendo 3DS and the Nintendo DS, and even if we combine the numbers, they do not reach the performance of the Nintendo DS sales of the previous year in both November and December.
) is when you combine the Nintendo 3DS and the Nintendo DS, and even if we combine the numbers, they do not reach the performance of the Nintendo DS sales of the previous year in both November and December.
Even though the Nintendo 3DS sold well late last year, I think it did not sell as well as it did in Japan, because unlike in Japan, we were not able to sustain the momentum in September and October and, therefore, it did not strongly enter the year-end sales season.
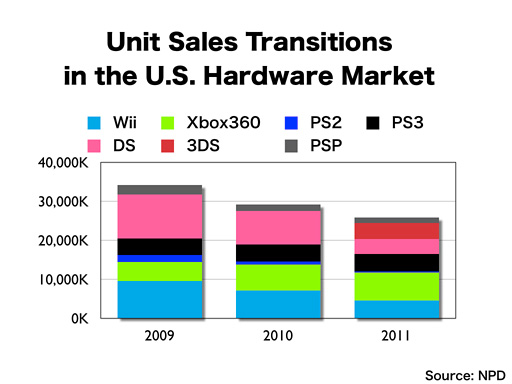
This chart shows the yearly hardware unit sales during the past three years in the U.S. Even though there was a slight shrinkage, the U.S. is a huge market where hardware sales are 2.5 times those of Japan. Unlike Japan, the leader of the hardware market is home consoles instead of handheld devices.
Nintendo hardware saw the largest decrease, but dominated shares for handheld hardware and is leading the total sales of hardware in total with more than 12 million units.
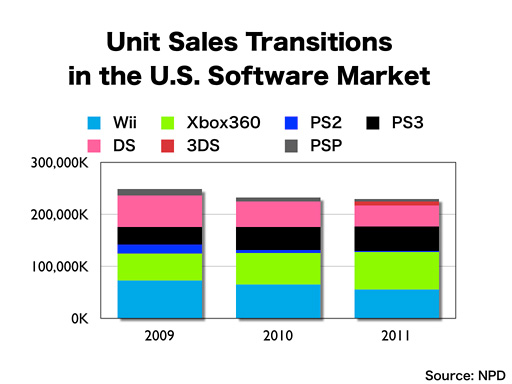
This chart shows the yearly software unit sales during the past three years in the U.S.
The market scale for software in the U.S. is four times that of Japan and, compared to Japan, highly dependant on software for home consoles.
The software market for the Nintendo 3DS did not show much presence compared to the hardware market because the software market was not fully vitalized until the two Mario titles were released late last year, but we can expect large growth this year.

Finally, Europe.
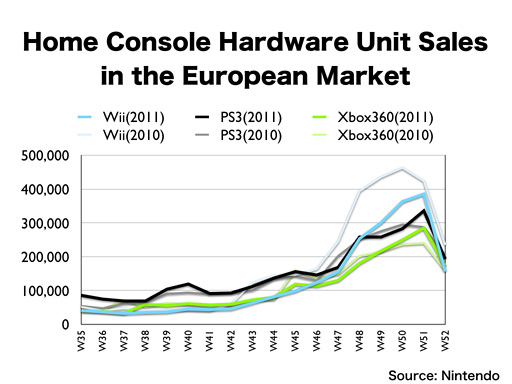
Here are the sales transitions of home consoles in the European market. Nintendo gathered the data from independent market research companies in the European region to estimate the total sales in Europe.
In Europe, it resulted that out of the home consoles, the Wii sold the most in December; however, we can see that the beginning of the year-end sales was slower and the peak was lower compared to that of the previous year.