for Fiscal Year Ending March 2013
Oct. 25, 2012

Lastly, let me talk about the U.S. market.
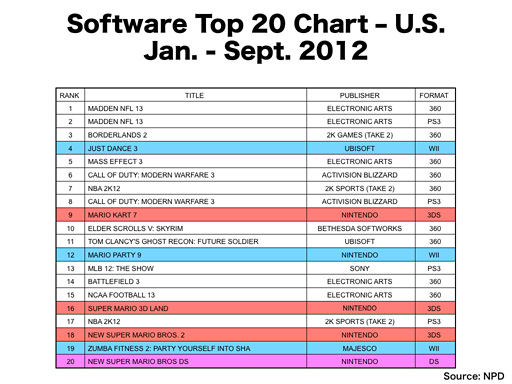
This chart shows the top 20 titles from January to September 2012 in the U.S. game market.
As it was the case last year, we have seven Nintendo titles included in the chart. However, while we have three new titles for Nintendo 3DS, we do not have as strong a presence as we do in Japan.
As in Europe, the only titles designed for handheld systems are the four Nintendo titles, and all of the remaining titles are for home consoles. Another thing to note is that in the U.S., Microsofts Xbox 360 is enjoying a lead over Sonys PS3, with nine titles listed for its platform, which is the exact opposite of what we are seeing in Europe.
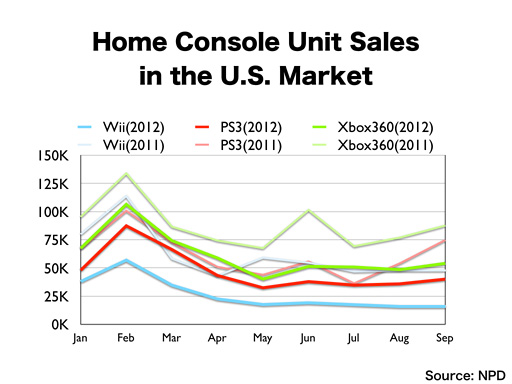
This graph, which is based on NPDs data, shows weekly Wii, PS3 and Xbox 360 sales from January to September in the previous year as well as the current year. The light colors represent last years data, whereas the dark colors represent this years. As I have repeatedly stated, NPDs monthly data include four or five weeks depending on the month and for this reason the graph consists of weekly averages.
A notable feature of this comparison is that every platform has dropped considerably in sales on a year-on-year basis. The U.S. home console market has traditionally been strong in contrast to its Japanese counterpart, but as it has been six years since all of the current home consoles were put on the market, the fact that they are nearing the end of their product cycles is clearly having a big influence on their sales.
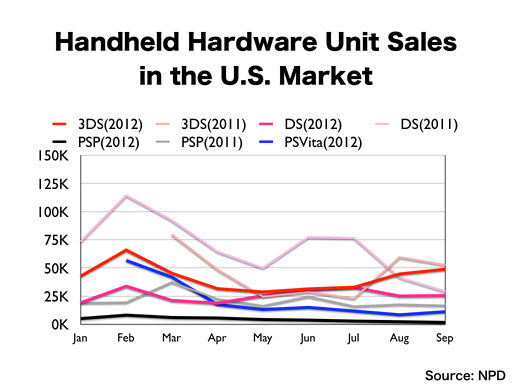
This graph compares the sales of handheld systems by looking at weekly figures for each month in the U.S. market for the previous year as well as the current year.
Nintendo 3DS is the only platform which has enjoyed better sales than last year and has been leading the market, even in the month of February when PS Vita was launched, but its sales levels are relatively low. Considering that the U.S. market could potentially be more than twice as large as its Japanese equivalent, our current sales levels cannot be said to be satisfactory. Although the sales of the hardware have increased after the launch of the Nintendo 3DS XL system, the U.S. was the only market out of the three regions in which the sales boost did not exceed that of last years markdown. Sales almost recovered to the level of the previous year in September and Nintendo 3DS has performed better in October. We are working hard to further develop the sales.
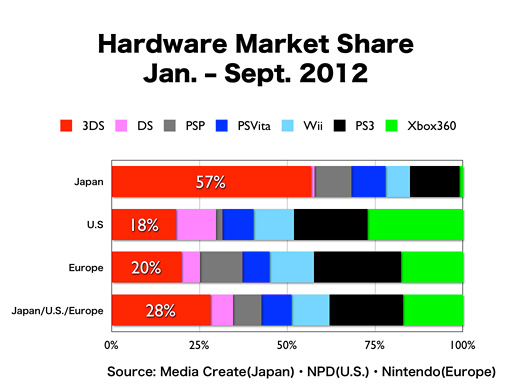
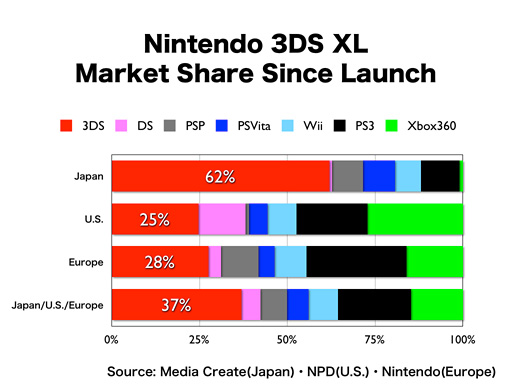
This graph compares the hardware breakdown of each market by putting together all the data that I showed so far as well as additional Japanese data that cover until the end of September.
The last bar consists of all three regions and we can see that just over 50% of hardware sales come from handheld systems.
In the Japanese market approximately 78% of hardware sales are accounted for by handheld systems, amongst which Nintendo 3DS has an overwhelming presence, and Nintendo 3DS represents nearly 60% of total hardware sales.
In the U.S. market handheld systems have the lowest share in the market, namely 40%, and we have so far been unable to boost the Nintendo 3DS sales there.
On the other hand, Nintendo DS, shown in pink in the graph, still has a relatively big presence, and this is because the Nintendo DSi system is currently sold for 99 dollars in the United States. In contrast, Sonys PSP has a fairly big share in the European market, but this is because Nintendo DS is not offered at a reduced rate in Europe and the more cost-effective model of the PSP, offered at 99 euros, is doing well in some countries. As it has been the case for some time, handheld systems tend to have the largest market share in the Japanese market, while home consoles tend to have the largest market share in the U.S. market. With the Wii U system coming out towards the end of the year, home consoles have dropped in sales on a year-on-year basis, but unlike in Japan, both Nintendo and Sony have so far been unable to achieve a large market share for their newly-launched handheld systems.
The following graph, however, gives the same comparison from the time the Nintendo 3DS XL system entered the markets, in July in Japan and Europe, and in August in the United States, by extracting and comparing relevant data that correspond to that time frame.
The graph includes all sales data from the last week of July through the second week of October for Japan and Europe as we have weekly sales data for these two regions, whereas it only includes data from August through September for the U.S. market since we only have monthly data at our disposal. As you can see, the Nintendo 3DS system gained more market share in not only the Japanese market, where it had already been in good shape anyway, but also in the U.S. and European markets, and the environment surrounding the Nintendo 3DS system did indeed improve this summer.
Also, I know that many people think our Nintendo 3DS business is not doing as well as our Nintendo DS business did because we performed a markdown within less than six months of its launch, but I would like to draw your attention to the following.
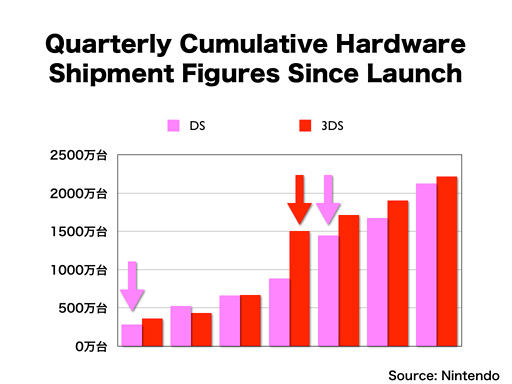
This graph has been created based on sales figures that we announce every quarter in our financial announcements and compares Nintendo DS and Nintendo 3DS in terms of their quarterly cumulative hardware shipment figures. The Nintendo 3DS system has now passed its seventh quarter, and compared with the Nintendo DS, the Nintendo 3DS has in fact been progressing at a faster sales pace. I know that many think that the market completely changed when the Nintendo DS Lite system was launched, but the two bars to the right of the graph show the sales transitions that took place after the Nintendo DS Lite was launched. What I would also like to point out is that we launched the Nintendo DS system towards the end of the year, which means that this contains the results of two year-end sales seasons. On the other hand we launched the Nintendo 3DS system at the beginning of the year, which means that this only contains the results of just one year-end sales season. With the Nintendo DS system, we were first able to achieve considerable momentum in the Japanese market. Then the European market followed. The U.S. market, which is the largest of the three, was last. If you think that the Nintendo 3DS is not off to as good a start as the Nintendo DS because we took a tough decision back in 2011 to perform a markdown, then I would advise you to refer to this graph and think again.

Thanks to the success of the Nintendo 3DS hardware and software, the Japanese video game market grew on a year-on-year basis, but the overseas markets shrunk. The Nintendo 3DS system itself did grow in sales and we sold approximately 2.5 times more Nintendo 3DS software units than we did last year, but Nintendo 3DS is not strong enough yet to prevent the overseas markets from shrinking.
I would like to now talk about our prospects for the year-end sales season under these circumstances.
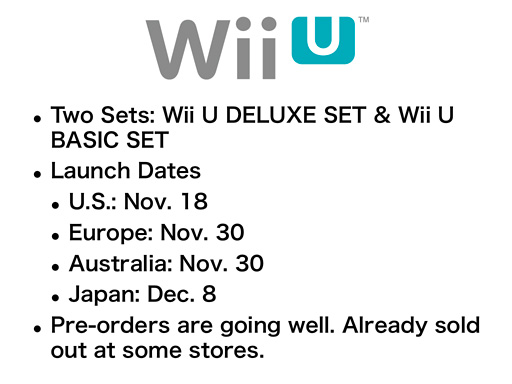
First let me talk about Wii U. On September 13, we announced details about the two SKUs, the Wii U DELUXE SET and the Wii U BASIC SET, as well as their prices, configurations, launch window titles and launch dates in Japan, the U.S. and Europe. The launch dates for the regions are as shown here.
After making this announcement, we provided our retailers with possible allocation numbers. Although we had not begun advertising in the mass media at that time, many pre-orders started to be placed at retailers, and now we are even hearing that pre-orders are already sold out at some stores.
Of the two SKUs, it seems that the Wii U DELUXE SET, which is the high-end model, is doing better in terms of pre-order numbers. To give a nice anecdote which illustrates how well pre-orders are doing at the moment, GameStop, which is the largest specialty retailer of video games in the U.S., created a "waiting list" after all of their allocated pre-orders had been sold out, and as of last week, more than 250,000 consumers had put their name and contact details on the waiting list for a Wii U system.
As production only started this summer, it has now become more likely that it is our production capacity, rather than consumer demand, that will place limits on our Wii U prospects for this calendar year, but we will make every effort to supply as many units as possible, and we will strive to continue to ship Wii U hardware without any interruptions in each region even after its launch.
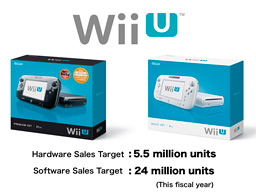
In this fiscal year we are looking to ship 5.5 million units of Wii U hardware and 24 million units of Wii U software.
By the way, when we launched Wii six years ago, we shipped 5.84 million units of hardware and 28.84 million units of software in its first year. Please note that while this software sales figure includes bundled copies, the software sales estimate I have just shown does not.