for Fiscal Year Ended March 2010
Jan. 29, 2010 - Presentation by Satoru Iwata, President
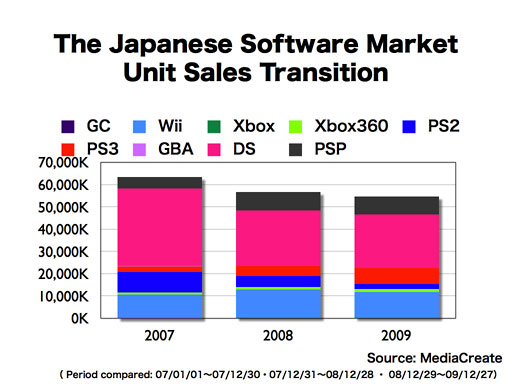
This graph shows the software unit sales transition in Japan. Even with some recovery in the latter half of the year, due mainly to the lack of hit titles in the first half of the year, both Wii and Nintendo DS showed slight decreases in software unit sales in 2009 compared with 2008.
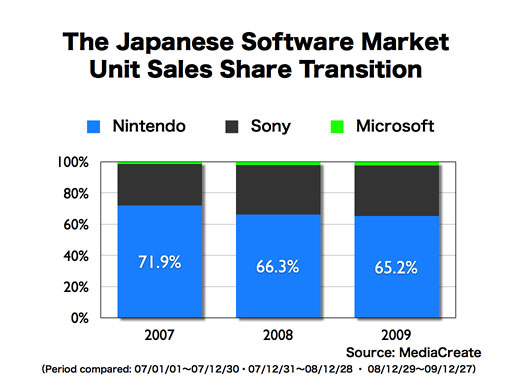
When we compare the software unit sales shares between the three platform manufacturers, the share of Nintendo software decreased a bit from the previous year.
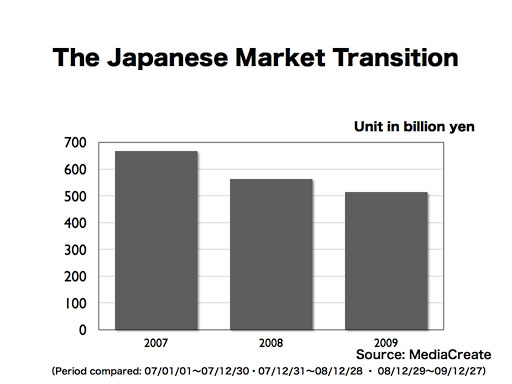
So far, I was discussing the Japanese market by looking at unit sales numbers. The graph you are seeing now is based upon the data publicized by MediaCreate and shows the entire Japanese market transition in yen sales, including both hardware and software.
It's regrettable to say that, due to the hardware sales decline and hardware price cuts since the fall of 2009, the Japanese video game market has shown a decline two years in row.
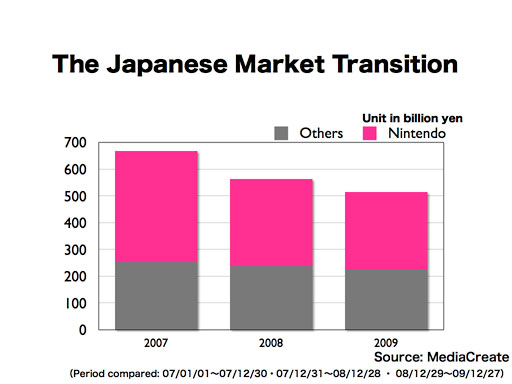
We have identified yen sales of Nintendo products in this graph with a different color. The momentum created in December 2009 could not compensate for the slower sales in the first half of the year. As a result, even though the difference was not significant, yen sales of Nintendo platform products showed a year-on-year decrease.
On the other hand, thanks to the regained momentum for Wii at the end of 2009, many people played video games, and we are now able to see a positive sign.
Nintendo has been periodically conducting a gaming population survey with a total of approximately 3000 people in Tokyo and Osaka and I'd like to share the recent results to see the Japanese gaming population transition.
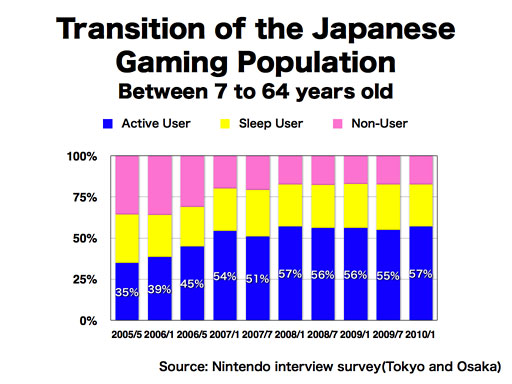
In this graph, identified by the blue color are the people who have played video games in the last 12 months, including those who played other companies' video game systems. We are calling them "Active Users." People identified by the yellow color are those who used to play video games but have not played at all in the last 12 month. We call them "Sleep Users." Pink are "Non-Users," those who have never played video games.
Nintendo has been conducting this sort of survey since 2005 and, for sometime now, the age demographic has been people aged 7 to 74, but for the first two surveys, we only interviewed people aged 7 to 64, so these two initial results were shown solely for your reference. The Japanese gaming population had shown a decrease in our July 2009 survey due to the lack of hit titles in the first half of 2009. Since fall last year, however, it once again started to show growth. In the end, the Japanese gaming population increased to reach one of its highest levels.
It is one of the outstanding characteristics of this industry that a hit software title has the ability to vitalize the entire industry and to change the trend of the whole market. What we are observing today must be a typical example of this.

Now, I'd like to talk about the U.S. market.
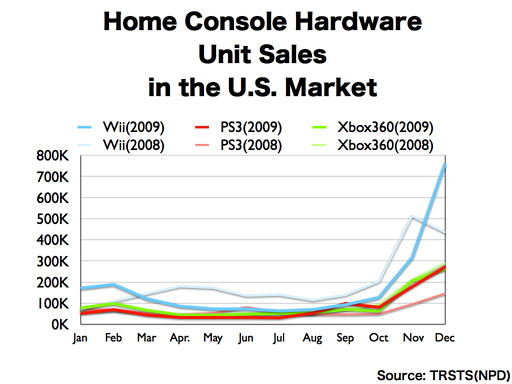
This chart shows weekly sales of Wii, PS3 and Xbox 360 in the U.S., based on NPD data for 2008 and 2009. As I have mentioned in the past, this data from the independent NPD Group is published only monthly, and the monthly data fluctuates from a four-week month to a five-week month, so in this graph, we are showing the weekly averages. Traditionally in the U.S., home console video games have played a central role in the business. But in 2009, the home console market did not show the strong performance that it used to show before. Wii also had lost its momentum in March 2009 and, as you can see, the Wii hardware unit sales results were below 2008 level month after month, which must have caused anxiety among yourselves about the future. However, the sales of Wii sharply rose in December. The December Wii sales of 3.81 million units set the record for monthly sales of all video game hardware in history in the U.S., and brought back the momentum to the console.
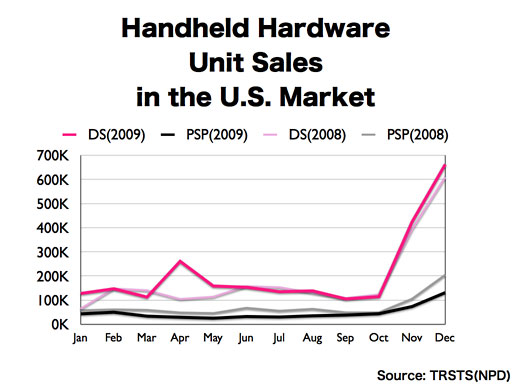
This shows a year-on-year comparison of weekly sales figures of Nintendo DS and PSP in the U.S.
The upward tick of Nintendo DS sales in April 2009 was due to the launch of Nintendo DSi. Nintendo DS had shown good sales in 2008 and, even compared with that great performance, Nintendo DS in 2009 showed an even better sales pace. The monthly sales unit of Nintendo DS in December 2009 was 3.31 million, which were the highest monthly sales record for Nintendo DS since its U.S. launch. Also, the yearly sales of Nintendo DS reached 11.22 million units in 2009, which was the highest yearly sales of this handheld machine since its launch in 2004. This annual unit sales also broke the previous record of 10.23 million Wii hardware sales in 2008 and, thus, established the new video game hardware yearly sales record in the U.S.
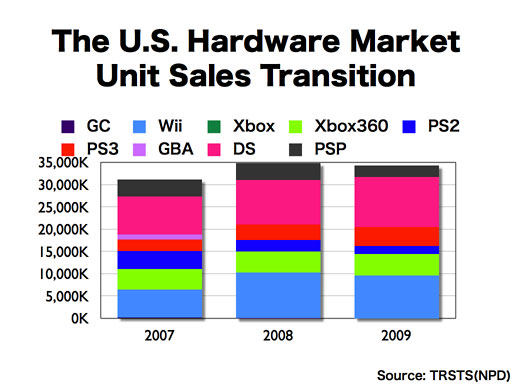
While Nintendo's hardware unit sales in the U.S. increased in 2009, when we look at the whole hardware market in this fashion, we notice that the total U.S. hardware unit sales slightly declined when compared with 2008.
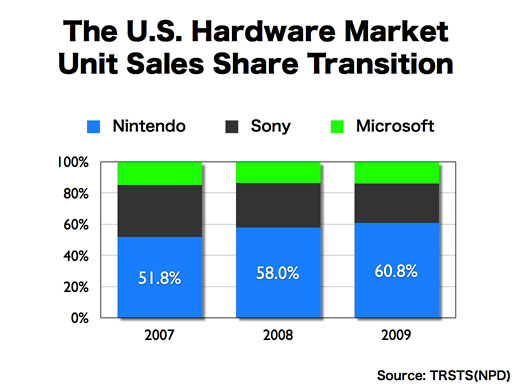
When we see the U.S. hardware market from the perspective of the share transition between the three platform holders, the share for Nintendo platforms increased, and it exceeded 60% for the first time.