for Fiscal Year Ended March 2011
Apr. 26, 2011 Presentation by Satoru Iwata, President
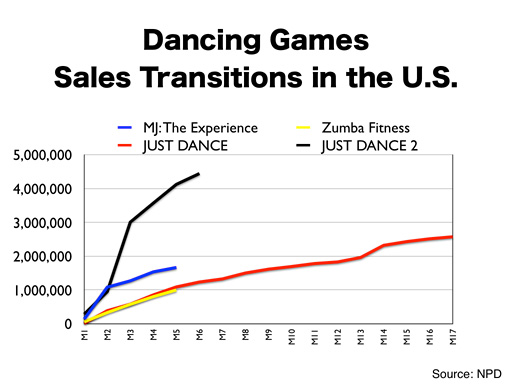
The sales transitions I introduced earlier look like this by adding these two titles to the graph. The unique point is that the sales momentum has not decreased even after the turn of the year, which is similar to the transition of the initial "JUST DANCE."
The same trend can be seen in Europe. "ZUMBA Fitness" was released for other consoles at the end of last year, while it was released for Wii only just recently, but I hear that the sales for Wii exceeded the cumulative sales for the other consoles only two weeks after the launch for Wii, which made me believe that dancing games and Wii are a good match.
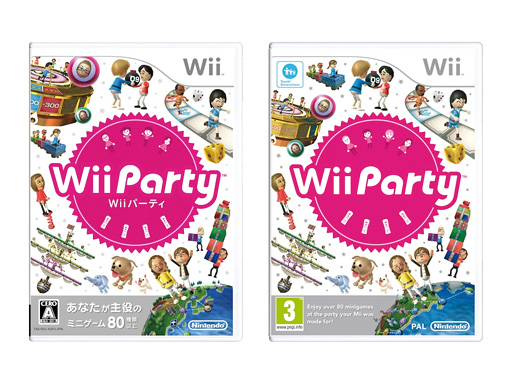
Finally, I would like to introduce "Wii Party."
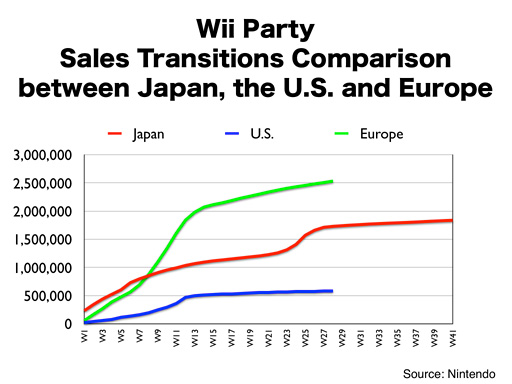
Even after the turn of the year, the sales in Europe, shown in green, are steadily growing. This indicates that it has established its position as software that sells continuously, like "Wii Fit" or "Wii Sports Resort," which became representative titles for Wii, so I assume that the possibility of "Wii Party" selling on a long-time basis has grown.
However, I think that this software has the potential to sell more in the U.S., so we decided to attempt to expand the sales further in the U.S. starting from this week. We will endeavor to bring you good news in the future.
Now, as I have mentioned several times in the past, Nintendo is periodically researching the transitions of the gaming populations.
This is a different perspective from how much hardware or software was sold, so I would like to introduce the latest data on this occasion.
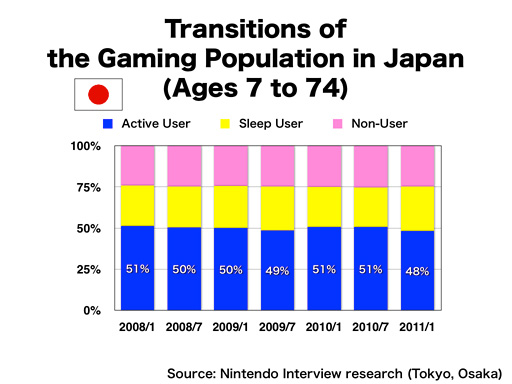
This graph shows the transitions of the gaming population in Japan.
The blue part in this graph stands for people who have played games on home gaming consoles, not only Nintendo consoles, in the past year. We have defined these users as active users. The yellow part represents consumers who have played with video game systems in the past, but have not played with them in the past year, which we define as sleep users. The pink part indicates the consumers who have not played with video game systems at all, which we define as non-users.
The research in January this year showed a decrease in the blue part of this graph, which is the number of active users in Japan, and the number of sleep users increased, which means that the gaming population decreased even though it was right after the year-end sales season. And, when we color-code the number of people who are enjoying Nintendo DS or Wii,
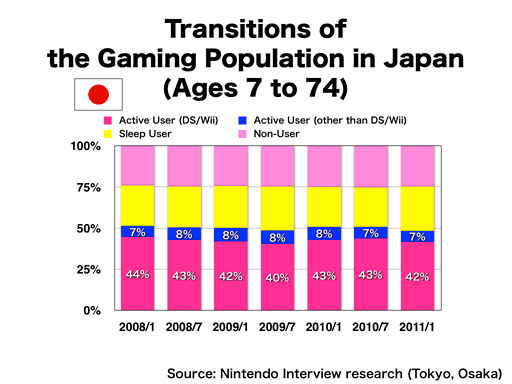
The graph will look like this.
By checking the number of consumers enjoying Nintendo DS and Wii, we didn't find any significant changes in the number of consumers playing Nintendo DS, but the number of consumers enjoying Wii had decreased by about two million people compared to our research six months ago. Also, as you imagine, due to the hit of "Monster Hunter," consumers playing with PSP increased but, at the same time, consumers enjoying PS2 decreased, which became one of the reasons why the number of sleep users increased.
Originally, the ratio of sleep users was high in Japan, and it is a characteristic of the Japanese market that more consumers tend to stop playing games compared to foreign markets but, on the other hand, we understand that this happens because we are failing to adequately communicate what software the consumers should play next, so we need to consider how to introduce the consumers to the next game and how to motivate the consumers to play this game.
For your information, you may be able to see that the situation was worse for Nintendo platforms in the summer of 2009, but then the appearance of "Dragon Quest IX" in summer and "New Super Mario Bros. Wii" at the end of the year changed the situation dramatically. I think it is a unique characteristic of video games that there is a chance that just one software title can change the situation so significantly.
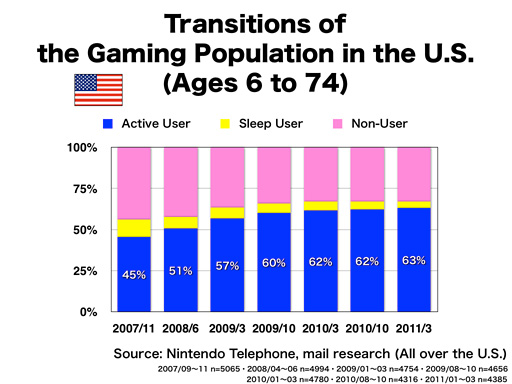
The U.S. showed contrasting results to Japan.
You, as a Japanese citizen, might feel that because the data has shown a decrease in the momentum of Wii or Nintendo DS hardware, the situation would be the same in the U.S., but it is different.
Indeed, the change in the non-user population, shown in pink, has been small recently, but the numbers of sleep users, shown in yellow, are gradually decreasing, and the ratio has become even smaller in the latest research. Now, when we color-code the number of people who are enjoying Nintendo DS or Wii,
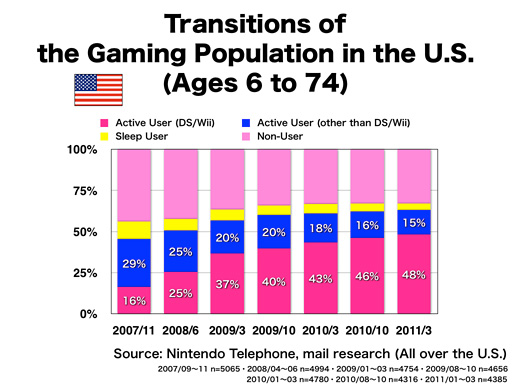
The graph will look like this.
This might give you a different impression to the impression you received from the sales transitions, but the number of consumers who are enjoying Wii or Nintendo DS is still growing in the U.S., even in the latest research.
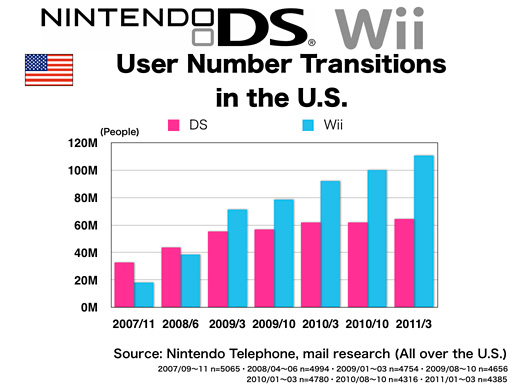
This is the transition of the number of consumers enjoying Wii or Nintendo DS, which we continuously investigate in our gaming population research.
From this graph, you may be able to see that, especially, the number of the consumers enjoying Wii is steadily growing in the U.S. I think one reason is the impact of the hit of the dancing games which have not caused a movement in Japan yet, and another reason is that the consumers in the U.S. do not stop playing games easily, and they tend to search proactively for the next game to play. In Japan, 56 Wii software titles were released in fiscal year 2010, but the number was 245 for the U.S., which clearly shows the big difference in the situation. We cannot simply compare the two markets by the number of software titles released, but from the perspective of whether we are answering the various trends of Wii users, there might be some causal relationship.

Now I’d like to spend some time to talk about our prospects for the future.
First of all, Wii's successor, which we announced yesterday.