Third Quarter Financial Results Briefing
for Fiscal Year Ending March 2013
Jan. 31, 2013
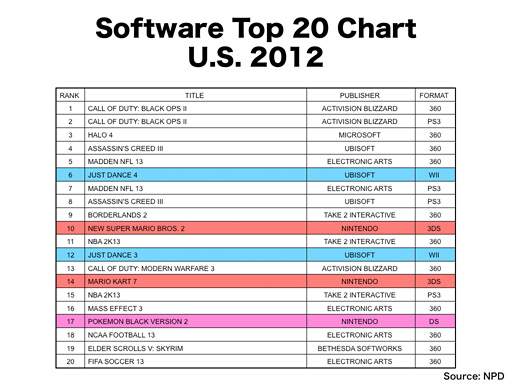
This shows the top 20 titles from last calendar year in the U.S. market.
Of the three main regions, Nintendo platforms performed least favorably in the U.S. market last calendar year. The downward revision to our financial forecast is largely attributed to the slow growth in U.S. sales.
There are only five titles for Nintendo platforms, and as for Nintendo 3DS, the only title from 2012 in this list is "New Super Mario Bros. 2" in 10th place. The situation is certainly very different from the Japanese list.
The fact that we could not include any first-party titles for our home consoles in the list, and were not able to create a virtuous cycle in this gaming industry that is driven by the presence of hit titles, summarized our year 2012 in the United States.
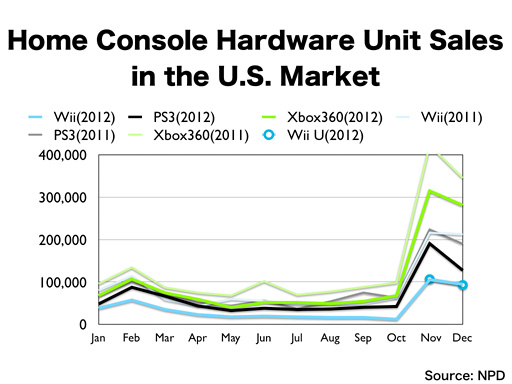
This graph compares the monthly sales of various home consoles in the U.S. market by looking at weekly data. As I have repeatedly stated, NPD, which is an independent market research company, only publishes monthly data, and as they include four or five weeks depending on the month, we look at weekly averages to see how sales have progressed.
The dark colors represent the year 2012 and the light colors the year 2011.
As the platforms from other companies are nearing the end of their product cycles, their sales paces were significantly slower throughout 2012 than in 2011.
Wii, which had always enjoyed a big presence towards the end of the year, did not see much enthusiasm in 2012 as consumer interest was scattered as a result of the Wii U launch. Wii and Wii U combined sold approximately the same number of units as the previous year-end sales season, and since Wii U costs more than Wii per unit, we could say that sales in fact grew, but even then we could never say that they progressed as we had originally anticipated.
Moreover, although other companies invested heavily in various trade marketing activities in stores, such as performing markdowns and bundling additional software, their sales saw a steep year-on-year decline, and we are now at a point where we as an industry need to make new propositions.
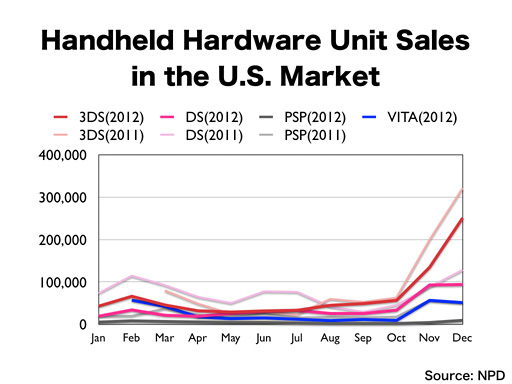
This graph compares the monthly sales of various handheld devices in the U.S. market by looking at weekly data that are based on NPD data.
In the U.S. market Nintendo DS still maintains a big presence, and Nintendo 3DS gained some momentum with the launch of Nintendo 3DS XL and "New Super Mario Bros. 2" in August, but the subsequent growth in sales was not sufficient. While it became the number one selling handheld system, its yearly sales decreased on a year-on-year basis, and in fact we sold fewer units in the U.S. than in Japan despite the fact that the U.S. market is significantly larger than its Japanese counterpart.
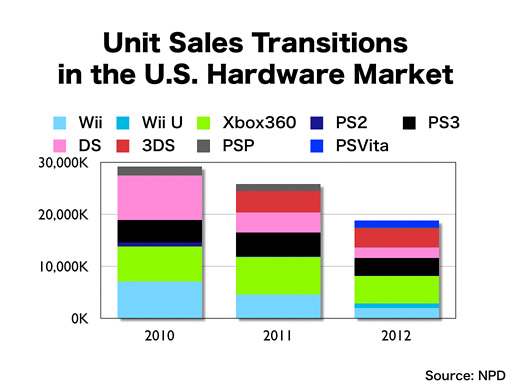
This shows the sales transitions of hardware in the U.S. market in the last three years.
The U.S. market is certainly larger than its Japanese equivalent, with approximately 2.5 times more hardware units sold in a typical year, but last calendar year the entire hardware market shrunk by 27 percent on a year-on-year basis, meaning that just two times more hardware units were sold than in Japan.
Nintendo remained as the company that sold the most hardware units that year, but because we lacked decisive hit titles, we sold about 8.50 million hardware units in total, falling below the 10 million mark which we had consistently surpassed for nine consecutive years.
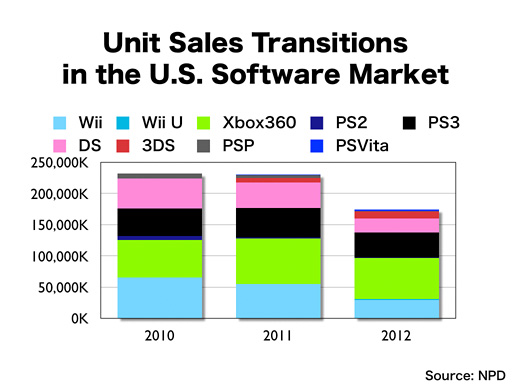
This shows how the U.S. software market progressed in the last three years.
Last year, the entire software market saw a 23 percent decline on a year-on-year basis.
This decline can in part be explained by the general transition to digital distribution, but software sales are on a declining trend on each platform, and the fact that we did not release for Nintendo platforms any titles powerful enough to influence the market is a particularly big reason for this decline.

Lastly, I would like to talk about the European market.
The individual markets in Europe are each unique, so I would like to paint an overall picture first before going into market-specific details.
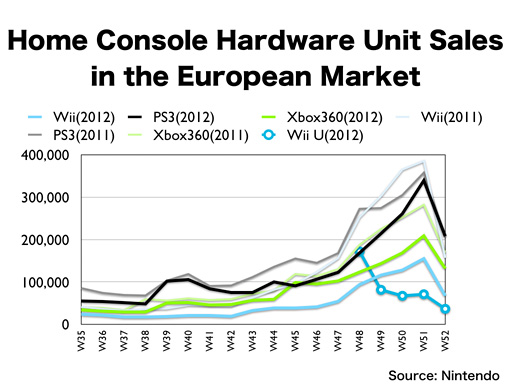
This graph shows how home consoles progressed in terms of sales in Europe. Based on sales data from market research companies in the individual markets, Nintendo estimated the total European sales.
In 2011, Wii had a presence across Europe as having sold the most hardware units of all home consoles in December, but in 2012, Wii did not achieve a big presence, and as for the other companies’ systems, despite investing heavily in trade marketing activities in stores, such as performing markdowns and bundling additional software, their sales, too, fell significantly on a year-on-year basis.
Not only for Nintendo platforms, but last year’s year-end sales season started slowly with a low sales peak.
Moreover, the new Wii U system lost its momentum the fastest in Europe.
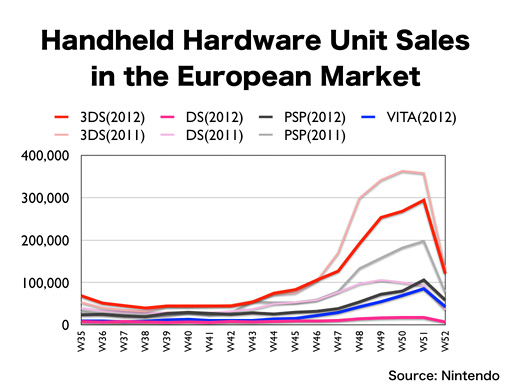
This shows the sales transitions of handheld systems in Europe.
Nintendo 3DS has a relatively bigger presence among the handheld devices, but its start is rather slow, and its sales peak is low, as is the case with the home console market. It is the first time for me to see that our handheld system did not reach a sales peak of 300,000 units per week ever since I started to explain this kind of data at opportunities like this.
As you can see, until around the week 46 sales progressed in almost the same manner as they did the previous year, so we had various trade marketing activities in stores in place to ensure that they would at least progress in the same manner from that point onwards too, but in the end they did not progress in the way we had originally expected them to from late-November.
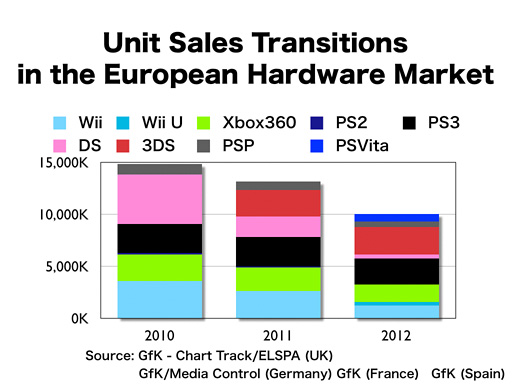
This shows how various hardware systems grew in sales in four major European countries in the last three years. The data was collected in the U.K., Germany, France and Spain to obtain a general picture of the entire European market.
In the last calendar year, hardware unit sales decreased by as much as 24 percent in Europe.
I will point out the differences between the U.S. and European markets later on, but Nintendo 3DS sales progressed particularly well in Germany and France, and Nintendo 3DS, of all existing platforms, was the only platform to experience an increase in unit sales.
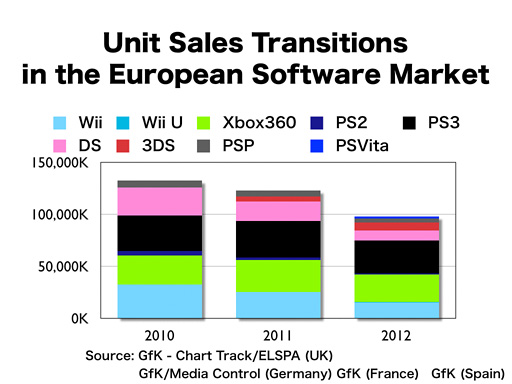
This, in turn, shows how software sales grew in the four major European countries. In 2011, software unit sales for handheld devices alone had a rather noticeable drop, but in 2012, as is the case with the U.S. market, we can observe a general decline in the overall software unit sales.
For these four countries I will refer to their individual hit charts to make their differences clear.