for Fiscal Year Ended March 2009
Jan. 30, 2009 - Satoru Iwata, President
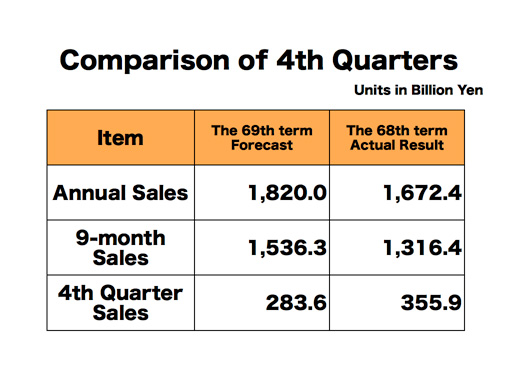
As seen in this slide, when you subtract the 9-month sales results from our 12-month sales forecast, you can calculate the theoretical 3-month sales forecast for the final quarter. As a result, the expected sales for the final three months of this fiscal year is 283.6 billion yen and shows a significant decline from 355.9 billion yen for the last 4th quarter. Looking at these figures may cause misunderstandings that Nintendo is quickly losing its business momentum despite our assertion that our main businesses are just fine, so I’d like to explain in further detail.
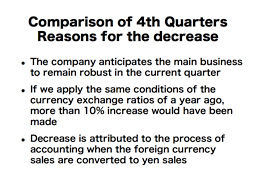
Two effects from the higher appreciation of yen can be attributed as the reasons why the anticipated sales in the current 4th quarter is less than the actual result of the corresponding 4th quarter a year ago. When we made the 4th quarter sales forecast, we based it upon the current business situation of continued solid sales of our products. The unit shipments and sales in non-Japanese yen have both increased in comparison to the corresponding previous quarter, and nothing is slowing down the business momentum.
In fact, when we apply last year’s exchange rates to this most recent forecast, sales increase of 10% or more over last year is found.
However, for the purpose of accounting procedure, we convert the non-Japanese-yen sales to sales in yen. Due to the recent sharp appreciation of the yen, our sales appear to have decreased in our final reporting in Japanese yen. Two elements are overlap to make the yen’s sales decrease appear larger. One is that we are anticipating a higher appreciation of yen in the current fiscal quarter in comparison with the final quarter of last fiscal year. This reason is rather obvious, but here is another element which maybe a bit more difficult to comprehend. The foreign currency exchange rates applied to the current fiscal quarter not only affects the final three months but also the entire twelve months of the fiscal year and, therefore, significantly decrease the 4th quarter sales when the 4th quarter sales are calculated by subtracting the 9-month result from the annual result. Well, I myself could not fully comprehend this point until Mr. Mori explained to me, so I’d like to take some time to explain a bit further.
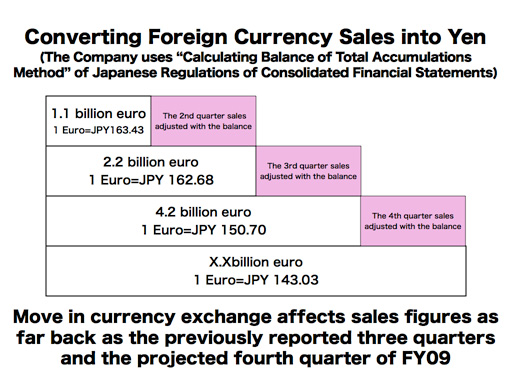
We apply what is called in Japan “the Calculating Balance of Total Accumulations Method” of the Japanese Regulations of Consolidated Financial Statements when we convert sales in currencies other than yen into the Japanese yen. According to this accounting method, a 12-month period is regarded as one fiscal year. The quarterly sales are calculated by subtracting the total sales in the fiscal year by the end of the preceding quarter from the total sales in the fiscal year as of the end of the subject quarter.
Why don’t I explain by using the example of sales made in euro, which has shown an especially big change in its appreciation towards yen. In the 1st quarter of the current fiscal year, we made 1.1 billion Euro in sales, and at that time, the average exchange ratio was 163.43 yen per euro. Nintendo Co., Ltd. accounted for this sales in Euro and converting it to sales in yen by multiplying these numbers. At the end of the 2nd quarter, the 6-month sales were 2.2 billion euros. We came up with the mid-term euro sales result in yen by multiplying this euro sales by 162.68 yen, which was the average exchange ratio for the 6 months. By subtracting the already-reported 1st quarter sales from this 6-month sales, we came up with the 2nd quarter 3-month sales, as the balance between the cumulative sales until June and the one until September. At this point, the Euro’s fluctuation was too small to give significant impact upon our accounting. At the end of the 3rd quarter, the 9-month euro sales was 4.2 billion euro, and the Euro’s appreciation against yen had significantly changed. The average exchange rate for the 9 months was 150.70 yen per euro. The euro sales were accounted in Japanese yen by multiplying these numbers in order for us to make the financial announcement yesterday. When we compare this average exchange ratio of 9 months with that of the 6 months, a difference of about 12 yen is found per euro. Following the applied accounting method mentioned before, the change in exchange rates had the effect of nominally decreasing the 3rd quarter three-month sales by 26.4 billion yen, based upon the calculation of 12 yen multiplied by 2.2 billion euro. And, in the current 4th quarter, as the yen is anticipated to appreciate even stronger against the euro, we estimate more than 32 billion yen negative effect on the 4.2 billion euro sales already reported as the 9-month result. And this is just the case for the Euro. Of course, we also had to take into considerations the change in anticipated exchange rates of the other currencies such as U.S. dollars. As I have shown, the fluctuations in exchange rates affect even the sales in the past quarters where the financial reporting of which had already been made. When the yen appreciates as quickly as it does today, it also affects the 4th quarter three month result alone to look as if the sales are down sharply.
As a number of media have reported, I think we can say that Nintendo experienced solid sales during the year-end sales season.
According to NPD, 10.17 million Wii consoles and 9.95 million DS hardware were sold in the U.S. between January to December 2008, which both set the new top two records for yearly video game sales. The previous record was held by Nintendo DS, when it sold 8.5 million units in 2007, so both platforms have renewed the previous record by a large margin.
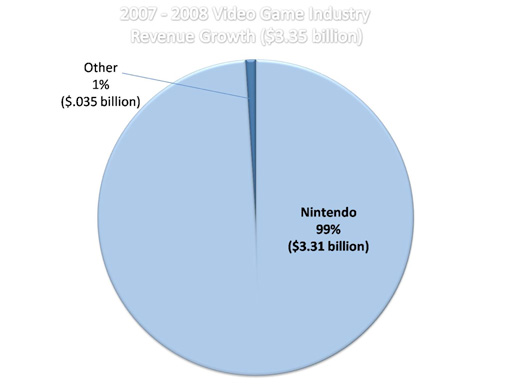
Even though the global economic downturn took place during the most important sales seasons of the year, the U.S. video game industry in 2008 showed 19% growth in its sales over 2007. The statistics attest to the fact that 99% of this retail sales increase was contributed by Nintendo hardware and software. Also, in the U.S., the third parties titles sold more on Nintendo hardware than on any other platforms for two consecutive months. Some had pointed out in the past that few third party software were successful on Nintendo platforms. As of the end of March 2008, there were only twelve titles for Wii by third parties whose global unit sales from the launches exceeded one million, and this figure excluded titles from Nintendo and Pokémon Company. However, this number jumped to thirty at the end of December 2008. Likewise, at the end of March 2008, there were 28 third party DS titles which made the million-sellers list, but the number reached 49 titles at the end of December. As the hardware expand their installed bases, we are starting to see a cycle where more titles from the third parties are making the million sellers list.
In Europe, 8.3 million Wii hardware were sold during the 12 months of the 2008 calendar year and set the highest yearly sales record for home console video games in Europe. During the same time period, 11.2 million units of Nintendo DS were sold, which is the highest yearly unit sales record of any video game systems in Europe.

During the year-end sales season, many purchased gifts in spite of the bad economy. Now that the year-end sales season is over, I understand that everybody is eager to know the most recent market situations around the world. The downturn of the global economy started by the global financial crisis did not appear to cast a great shadow over game industry at the end of 2008. Whether or not the industry will be able to keep its momentum after the demand of the gift-giving season has subsided is an important indicator to forecast the future.
So, I’d like to spend some time today to explain the most recent situation of the markets in Europe and in the U.S. I have brought with me some internal data.
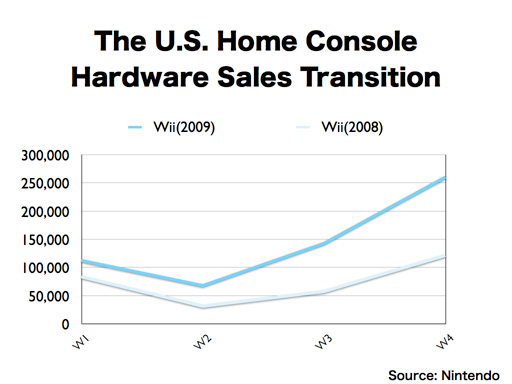
This slide shows the sales of Wii hardware in the U.S. from the start of this new year, and I am adding last year’s sales for comparison. The dip in the 2nd week, as was the case in last year, was due to stock shortage. The momentum of Wii continues even after the year-end sales are over, and in fact, the sales so far are twice as much of last year’s result.
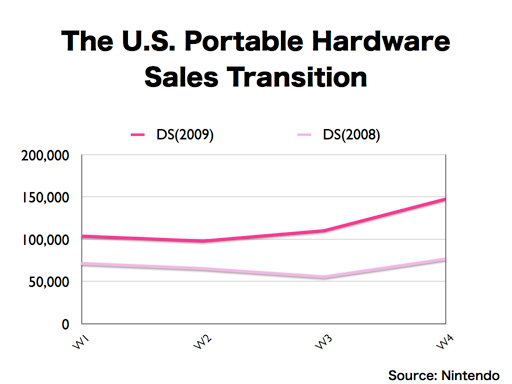
This slide shows the January’s sales of DS hardware. Due partially to the improved stock situation, the sales are up about 70% from last year. As is the case with Wii, we are not seeing any decreased momentum in comparison with that of the year-end.
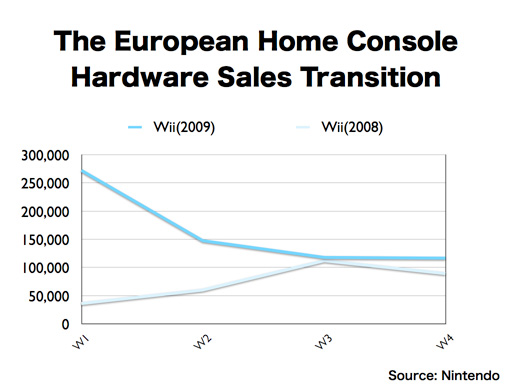
This is the sales data of Wii hardware in the major European countries in 2009.
The reason why the 1st week sales were very strong is because Spain has a gift-giving sales season at the beginning of the year called Three Kings. In 2007 and 2006, the Wii hardware inventory was almost completely depleted during the Three Kings periods so we could not take advantage of this Spanish sales season. For the first time since the launch of Wii, we were able to leverage upon the Three Kings demands. Thanks partially to this, the sales of Wii through the 4th week of January 2009 in Europe were more than twice as much of last year’s.
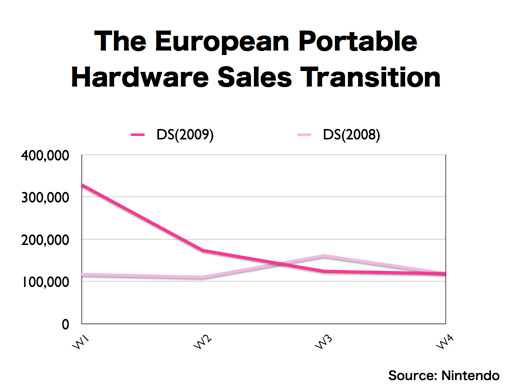
This graph shows DS hardware sales in major European countries this year. Comparing it to last year, DS was also able to take advantage of Three Kings, which contributed to the sharp rise in the 1st week of January over last year. The reason why last year’s 3rd week result was exceeding this year’s result was because DS hardware inventories in some countries were completely depleted during the 1st and 2nd weeks of last year and the demand was shifted into the 3rd week. Nintendo DS also was able to maintain its momentum from last year. The 1st 4-week sales of this year is up about 50% from the previous year.