Semi-Annual Financial Results Briefing
for Fiscal Year Ended March 2010
Oct. 30, 2009
Thank you very much for joining our Operational Briefing despite your busy schedules. I'm Satoru Iwata, president of Nintendo.
Today, I would like to first provide the general outline of our mid-term financial results that we announced yesterday. Then, I would like to further explain the current situations in Japan, Europe and in the U.S., and also about our future prospects. After my presentation, we will welcome your questions. Thank you for your cooperation.
First, let me briefly explain our mid-term results.
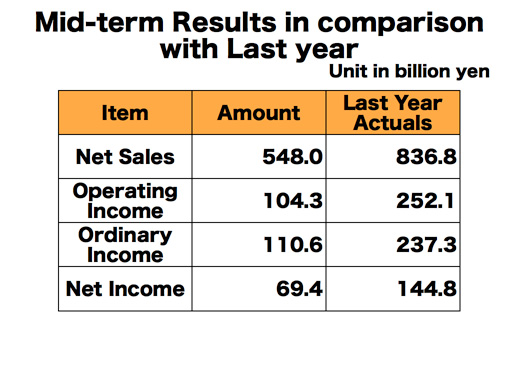
Let me explain the mid-term result of fiscal year ending March 2010. Mid-term net sales were 548 billion yen. In the same mid-term period of last fiscal year, we had a number of software titles from the beginning which strongly drove hardware sales, but we did not have such strong titles in this mid-term period. Japanese currency appreciated by more than 10 yen against the U.S. dollar and by little less than 30 yen against Euro, and its effect was as large as about 86 billion yen. And we cut the price of Wii home console. With such reasons, net sales decreased by 288.8 billion yen year-on-year. It had a similar effect on operating income, ordinary income and mid-term net income, and they were lowered to 104.3 billion yen, 110.6 billion yen and 69.4 billion yen, respectively.
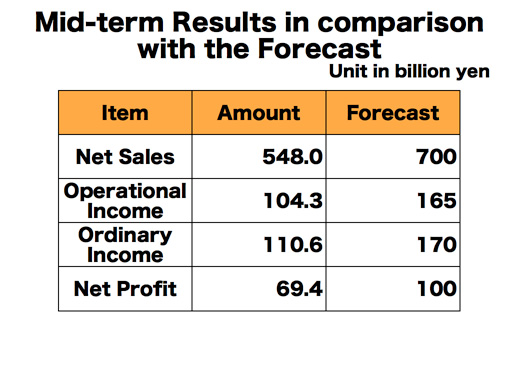
Let me explain the same consolidated mid-term results in comparison with the forecast we made in May.
The net sales were 548 billion yen against our forecast of 700 billion yen.
The operational income was 104.3 billion yen against our forecast of 165 billion yen. The ordinary income was 110.6 billion yen against our forecast of 170 billion yen.
The net income was 69.4 billion yen against our forecast of 100 billion yen.
These underperformances were attributed primarily to the lack of continuous release of software titles which could strongly drive hardware sales and price cut of Wii hardware.

Today, I would first like to start talking about the market situations of Japan, the U.S. and major European countries.
Usually, I would start by discussing the situation surrounding Nintendo DS followed by Wii because our gaming population expansion initially started with the portable Nintendo DS, followed by the Wii home console. Because the changes in the home console markets have significantly been affecting the entire video game markets this year, I'd like to first discuss that sector.
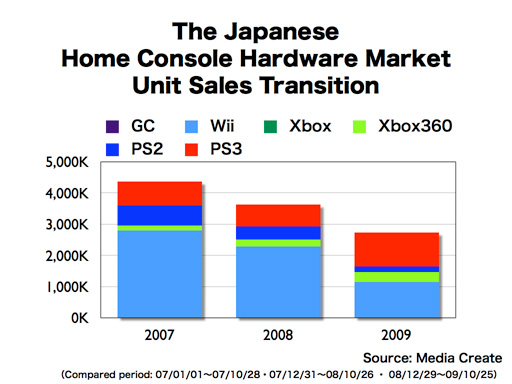
This graph shows the sales transition of home console hardware in Japan from January to the most recent week in the last 3 years. All three current generation hardware were launched by the end of 2006, and the home console hardware unit sales were significantly up in 2007. However, the total unit sales of home console hardware were down last year and this year. A notable dip can be seen in sales of Wii in this year, which is approximately half the size of last year. On the other hand, Sony's PlayStation3 showed a good transition, and they increased the unit sales by about 50%. The sheer contrast of the two platforms has often been reported lately.
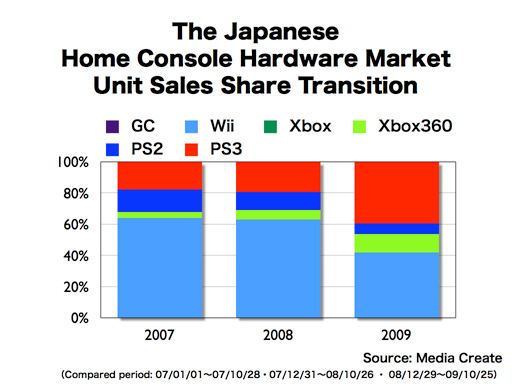
Although Wii held more than a 50% hardware market share through last year, Wii has 42% and PS3 40% share thus far this year, so both machines are neck-to-neck in Japan.
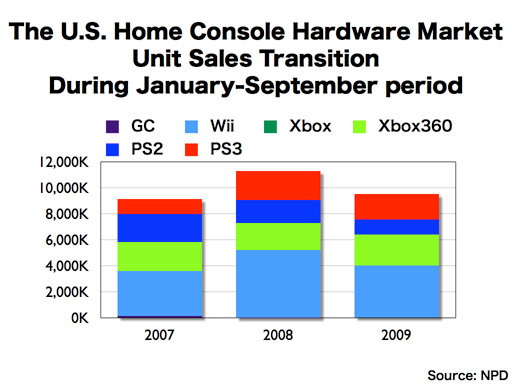
This graph compares the January to September unit sales of home console hardware in the U.S. from 2007 to 2009, based upon NPD data. The U.S. home console market grew significantly in 2007 and 2008 consecutively, but this year so far has showed decline over last year. However, it is obvious that the U.S. market is trending very differently than Japan. Except for Xbox360 from Microsoft, all home console hardware marked decreased unit sales from last year.
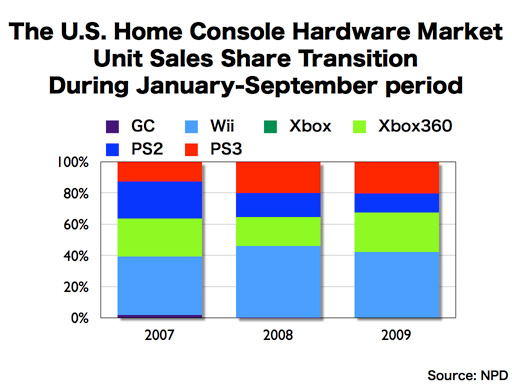
When we look at the unit sales share, because the total market sales were down, the decrease in Wii system's unit sales share was not very big. Please note that the 2009 data only includes one week of Wii sales after the markdown. We are aiming to regain the momentum during the upcoming sales season, and we are well in a position to do so.
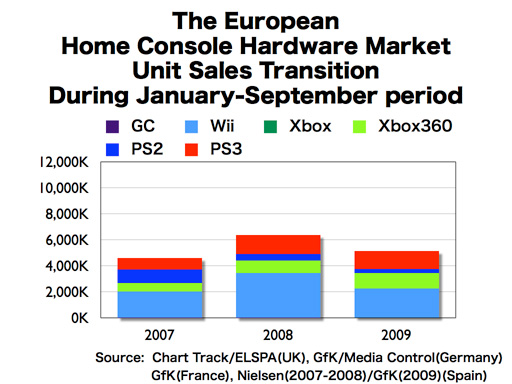
In this graph, Nintendo has gathered and tallied the home console video game hardware unit sales data for January to September periods from 2007 to 2009 disclosed by independent research companies in the UK, France, Germany and Spain. As I confirmed last year, these four countries are assumed to represent 75% to 80% of the total European market, and I'd like to focus upon these figures to discuss the pan-European trend. Please also note that, for the better comparison, we have adopted the same scale with the graph for the U.S. On the other hand, doing the same would make the Japanese graph rather hard to see, so we are applying a different scale for the Japanese graph.
The general trend is similar to that in the U.S. However, the decrease in Wii hardware unit sales is more severe than in the U.S. Both PS2 and PS3 from Sony showed a decrease in comparison with last year.