Semi-Annual Financial Results Briefing
for Fiscal Year Ended March 2009
Oct. 31, 2008 - Satoru Iwata, President

Thank you very much for joining our Operational Briefing despite your busy schedules. I'm Satoru Iwata, president of Nintendo.
Today, I would like to first provide the general outline of our mid-term financial results that we announced yesterday. Then, I would like to further explain the current situations in Europe and in the U.S., and also about our future prospects. After my presentation, we will welcome your questions. Thank you for your cooperation.

First, let me briefly explain our mid-term results.
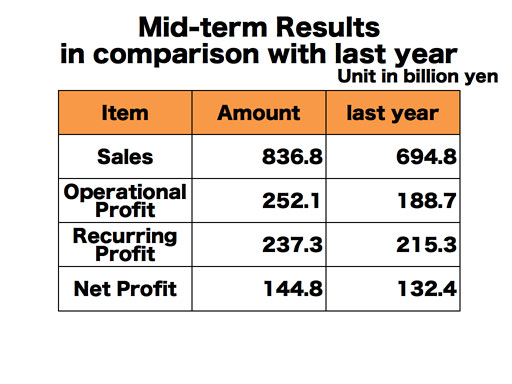
Let me explain the consolidated mid-term results for the fiscal year ending March 2009. Despite the higher appreciation of yen, especially against the U.S. dollars, during this applicable period to that of a year ago, sales were significantly up to 836.8 billion yen due primarily to the robust sales of DS and Wii in the overseas markets.
The operational profit was 252.1 billion yen, and the recurring profit was 237.3 billion yen. As for the mid-term net profit, mainly due to the increase in the recurring profit, it was up to 144.8 billion yen. For all these accounts, we have achieved record high mid-term results.
As we have already announced, we have revised our dividend policy from this fiscal year to make 33% of the consolidated mid-term operational profit as the resource for the mid-term dividend. Accordingly, while the mid-term dividend was 140 yen per share one year ago, we would like to pay this year's mid-term dividend as 660 yen per share.

As we have already discussed the current landscape of the Japanese video game market at our Nintendo Conference held on October 2nd, I'd like to speak today on the overseas markets, in particular those of the U.S. and major European countries.
While Nintendo's efforts to expand the gaming population have been making certain progress around the world, the results have been different in each market. Even though Nintendo started the challenge to expand the gaming population simultaneously around the world, the time when the actual change started to take place differs in each market depending on the characteristics of the market and when specific products were launched in each region. Also, we understand that the ratio between those who were already active game players, those who used to play but have since quit, and those who have had no interest in playing at all was different in each market at the time when we started this challenge.
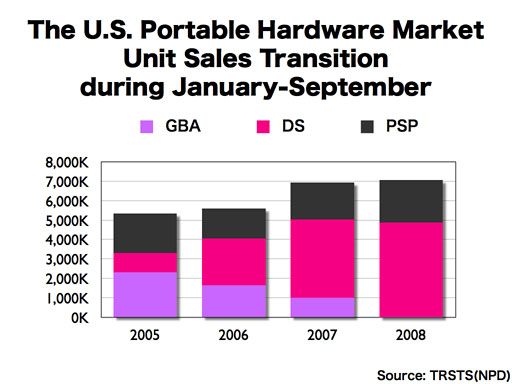
We are comparing the portable hardware sales in the United States during January-September periods from 2005 to 2008.
DS has shown another 20% increase in sales this year again and shows the biggest growth over the years among all the portable machines.
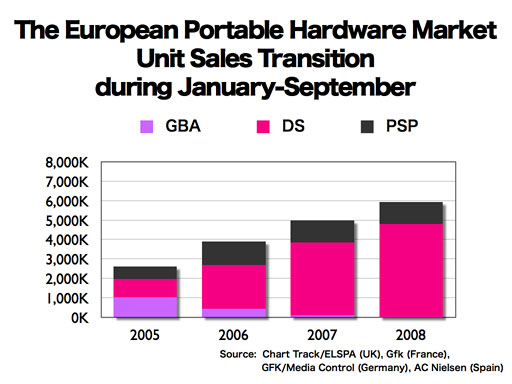
In this graph, we have gathered and tallied the data disclosed by independent research companies in the UK, France, Germany and Spain and are comparing the portable hardware sales during January-September periods from 2005 to 2008. As it is assumed that these four countries represent 75% to 80% of the total European market, I'd like to focus upon these figures to discuss the pan-European trend. DS showed another 27% increase this year. Back in 2005, the European portable hardware unit sales were about half of that in the U.S. Given the fact that these four countries now represent little less than 80% of the pan-European market, Europe now appears to have surpassed the American market.
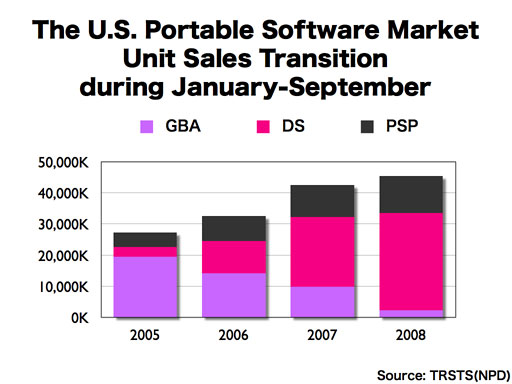
We are now comparing the U.S. portable software sales transitions by using the same NPD data. The increase in the portable software sales is more notable than that of the hardware. DS software showed another 39% increase this year, and is approximately 10 times as much software sold in 2005.
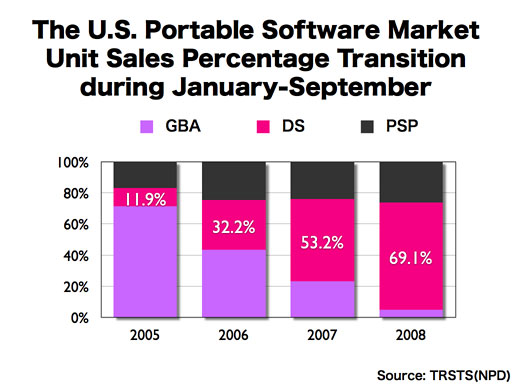
When we compare the overall percentages in this manner, the increased significance of DS in the portable market becomes more apparent.
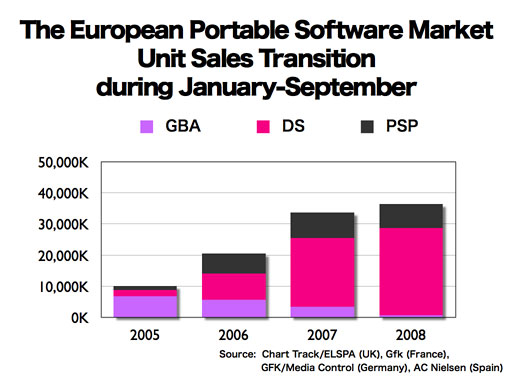
The European portable software market has grown even more explosively than in the U.S. The total portable software market increased by 3.7 times in the three years. When we focus upon the DS software sales, it has grown by 14 times in the same time period.
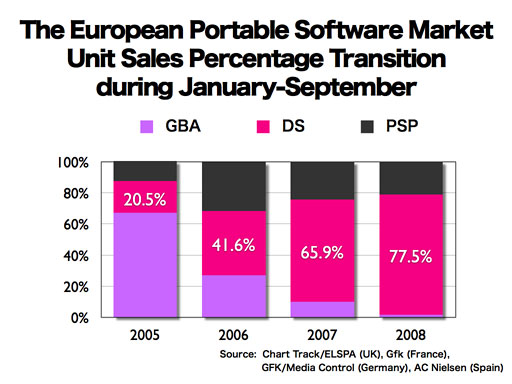
In Europe, DS portable software accounts for more than three-quarters of the total portable software sales.