for Fiscal Year Ended March 2009
May 8, 2009 - Presentation by Satoru Iwata, President

A number of independent research companies around the world report on how many game systems have sold. However, these sales data do not show demographics data such as age and gender. Since one game system is usually shared by several users, looking into the buyers' age and gender does not paint an accurate picture of the user population expansions. Accordingly, starting in May 2005, we have been conducting interview surveys with approximately 3000 people twice a year in Osaka and Tokyo in Japan in order to confirm the progress of our gaming population expansion strategy by estimating the number of game players, the number of people who used to play but who do not today, and those who have never played video games at all, and by researching the gaming population for each hardware.
We started a similar endeavor later in the overseas market. In the U.S. we have asked Mediamark Research & Intelligence, a leading research company in the U.S., to conduct the research three times since 2007. For each research, the methodology used are random phone samplings asking for cooperation, then survey by mail. We have had more than 4500 people participate.
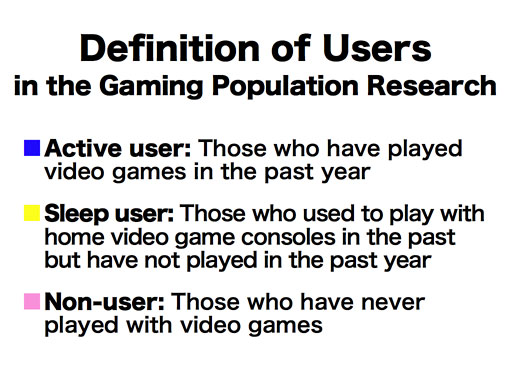
For the purpose of this gaming population research, Nintendo divides the customers into the three groups. We define those who have played any video games in the past year as an Active User. This includes not only Nintendo game systems but other video game systems from other companies. We will identify them in blue in the graphs that I will show you today. Next, we call those who used to play but have not played in the past year a Sleep User. We understand that the so-called Gamers' Drift phenomenon in the past occurred mainly because the number of Sleep Users increased. Sleep Users will be identified with yellow. Finally, those who have never played video games are identified as Non-users and with pink.
The Gaming Population Expansion that Nintendo is striving for can be explained as our efforts to increase the blue active users.
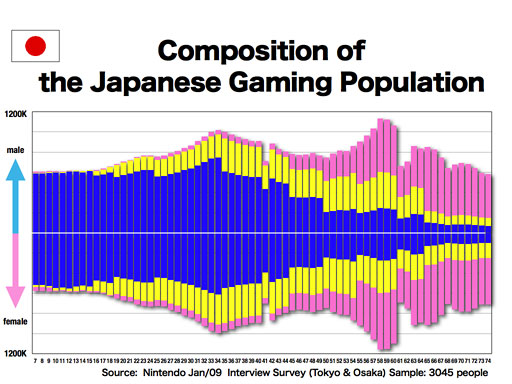
This graph shows the Japanese gaming population's composition in January this year. Upper half of the graph shows the male, and the lower half is the female. The left end starts at 7 years old, and the right end is at 74 years. We conducted the initial two surveys to people between 7 and 64 years old. However, since the company has been announcing its efforts to reach out to people between "5 to 95 years old," we concluded that conducting a survey only up to 64 years may not be enough. So, starting from May 2006, we have been asking people up to 74 years old to cooperate.
It is apparent from this graph that the younger the customers are, the more actively they play. As they grow older, many tend to play less or quit playing altogether.
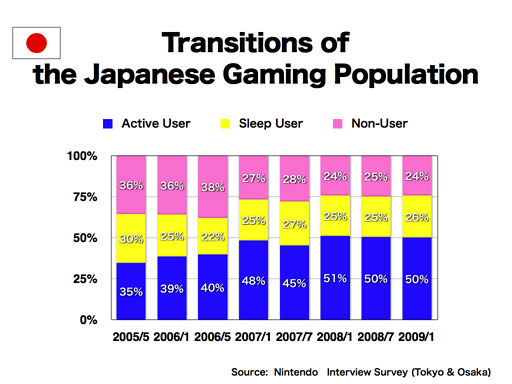
Let us look at this chronologically. The first survey was done in May 2005, when we launched Brain Training software for Nintendo DS. At the start of the next year, we can see that the number of sleep users decreased a bit and those who were drifting away from video games were once again starting to play. As of May 2006, we see the increase of non-users but that is because we started expanding the age group up to 74 years old then. This is shortly after the launch of Nintendo DS Lite, so even when we limit the age group through 64 years old, the total gaming population still increased by about 6 million. In January 2007, which is right after the launch of Wii, we saw the surge in the ratio of active users, or in other words, the gaming population. In actual numbers, the gaming population rapidly increased by some 9 million people. Around this time, the number of non-users significantly decreased, and those who had not played any video games were starting to enjoy themselves with games again. After this, there was a one-time drop in the gaming population, but for the past three surveys, the same level of gaming populations has been maintained. If we limit the age group until 64 just as we did for the initial surveys, the ratio of gaming population would be 56%, up more than 20% than the original 35%. I imagine these results are consistent with how you have been perceiving the gaming population around you.
Let us see the situation in the U.S. now.
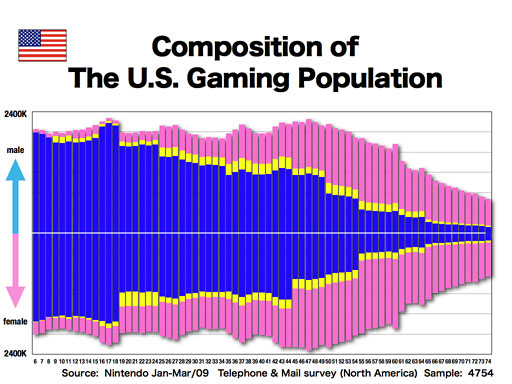
This graph shows the gaming population composition in the U.S. based on the survey of January-March this year. It took three months, which is longer than the time needed for the Japanese survey, because we sent out the surveys by mail. As in the Japanese graph, upper half of the graph is male, lower half the female. The axis of Age is younger as it goes to left and older towards the right end. Unlike in Japan, the lowest age is 6 and the oldest is 74 years old.
From first glance, it is obvious that yellow or Sleep users are small in the U.S. In other words, there are less customers who are drifting away from games.
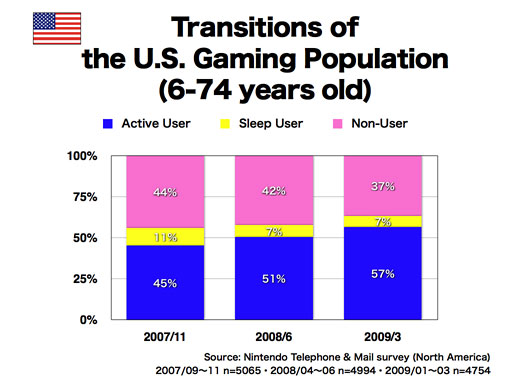
You are seeing the transitions of the share of gaming population based upon the three surveys in the past. The surveys were conducted for age groups between 6 to 74 years old.
We started this survey later than in Japan. Also, since the gamers' drift had not surfaced in the U.S. in the first place, the ratio of gaming population is higher in the U.S. With that, however, the U.S. trotted a similar path as Japan in this year and half. First, sleep-users started to return to active-users, and in the end, non-gamers became active users. You can see from this graph that the gaming population increased by about 30 million and that the ratio of the gaming population rapidly increased in the short time.
When we further separate the blue active users into those who play with DS or Wii and those who don't, ...
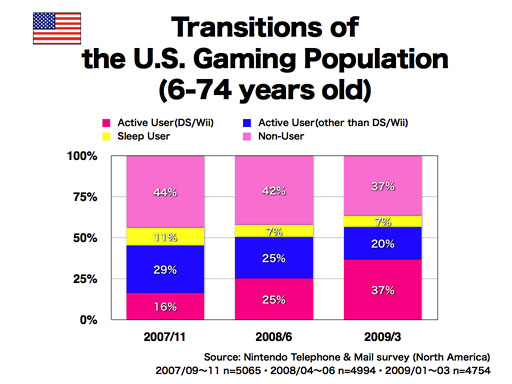
It looks like this. As you can see, the ratio of those who enjoy playing with DS and Wii are rapidly increasing. I showed you the transitions of sales in the U.S. market earlier, but it must be obvious that the growth has been led by the gaming population expansion shown here.
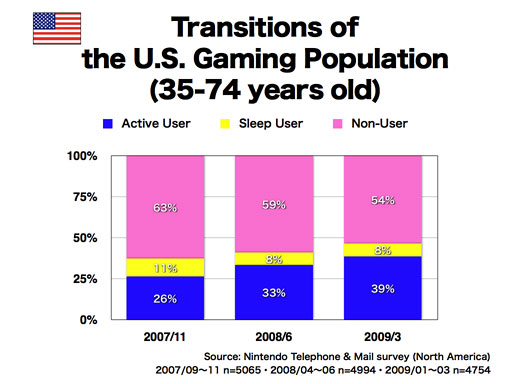
Age range of gamers also expanded as the gaming population expanded. When we focus upon people who were surveyed to 35 years or older, it looks like this. In the same time period, those who play video games increased about 50% in this 35 years or older group. In the same period, the increase in gaming populations among 6 to 74 years was about 26%. In other words, the 35 years + group expanded more compared to the overall market.
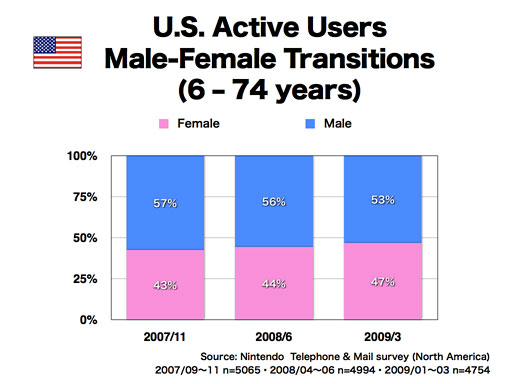
You are now looking at the transitions of female ratio among active users in the past three surveys. As the gaming population expanded, the female ratio increased.
Some time ago, it was primarily thought that video games was entertainment mainly for children and young male adults. As the gaming populations expansion progressed, this thought became obsolete. When we focus only upon the customers of DS or Wii, the female ratio reaches 49% in the U.S. Almost an equal number of men and women are playing.
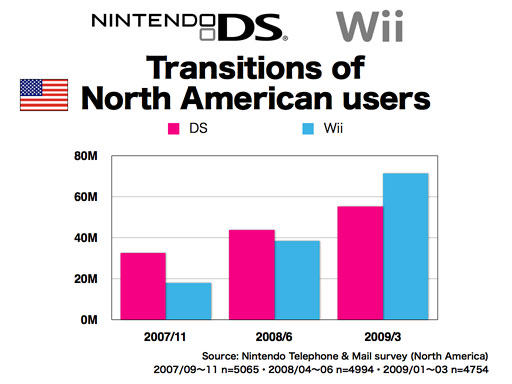
During the three surveys, the number of Nintendo DS and Wii customers drastically increased. In Japan, the expansion of Nintendo DS quickly expanded the Japanese gaming population. In the U.S., the number of Wii customers quickly outnumbered that of Nintendo DS. It can be said that this expansion of Wii has largely contributed to the expansion of the U.S. gaming population.