for Fiscal Year Ended March 2009
May 8, 2009 - Presentation by Satoru Iwata, President
Thank you for coming despite your busy schedule today.

First, I'd like to explain about the financial results of the 69th term.
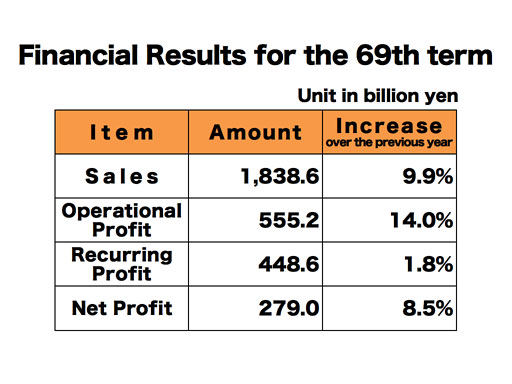
In the 69th fiscal term ending March 2009, the consolidated sales were 1 trillion 838.6 billion yen, up 9.9% from the previous fiscal year. Since the yen has rapidly become stronger since the fall of last year, it had the effect to decrease our overseas sales, when accounted in yen. There was also the effect of the slowing Japanese market as a whole. Yet, our overseas sales grew largely, and the company was able to achieve record sales in its history. The operational profit was 555.2 billion yen, up 14% from last year. At the end of the subject fiscal year, one U.S. dollar was traded at 98.23 yen and one euro, 129.84 yen. Yen became significantly stronger, especially against euro, when compared with how it appreciated at the end of the previous fiscal year, and 133.9 billion yen of foreign currency reevaluation loss was accounted. As a result, the increase in the recurring profit was 1.8% to become 448.6 billion yen. Due mainly to the increase in the recurring profit, the net profit was also up 8.5% to become 279 billion yen. For all these items, the company has renewed previous records.
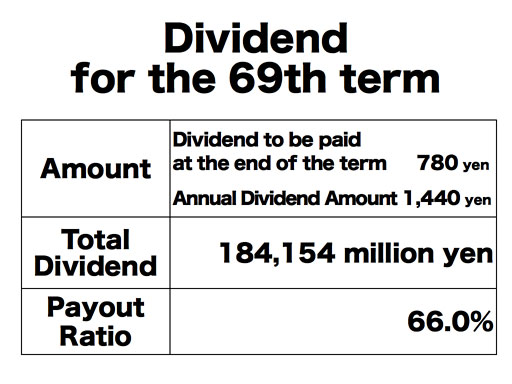
As we have been publicly explained in the past, the company has the dividend policy to decide the total dividend amount by choosing the higher number between 33% of the consolidated operational profit and the dividend payout ratio of 50%. The dividend becomes higher when we choose 33% of the consolidated operational profit as the dividend source. Accordingly, we are planning to pay 1,440 yen per share as the annual dividend. This annual dividend is 180 yen higher than the annual dividend that the company paid for in the previous fiscal year, 70 yen higher than our forecast in January, and the highest annual dividend to be paid by the company ever. As the company already paid 660 yen per share as the interim dividend, the dividend to be paid at the end of the fiscal year will be 780 yen per share. We would like to make the dividend payments after asking the Shareholders Meeting to resolve this.
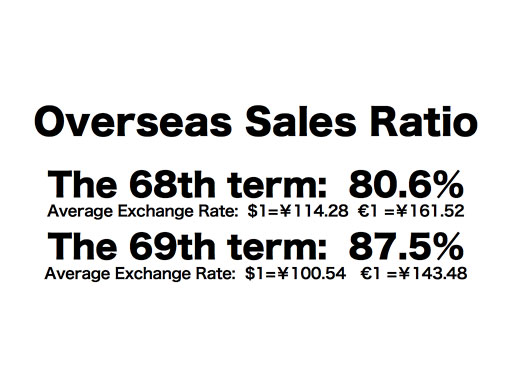
The ratio of overseas sales further increased from 80.6% in the previous year to 87.5% this year. The yen's average appreciation became significantly higher, and it had the effect of reducing overseas sales figures when accounted in Japanese yen. Still, the ratio of our overseas sales has increased mainly due to the large growth in overseas sales.
Since the growth in overseas markets are also notable in statistics, please take a look.
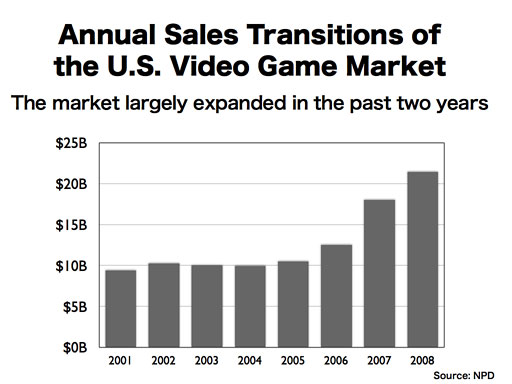
This graph is based upon the NPD Group's data in the U.S. and shows the annual transitions of video game sales in the U.S.
As you can see, the market significantly grew in the two years of 2007 and 2008. Given the world's economic situation since last fall, few industries are posting similar trends. In addition to the launch of Wii in December 2006 and its market expansion effect, the significant sales expansion of DS in the U.S., which started later than Japan and Europe, contributed to the growth.
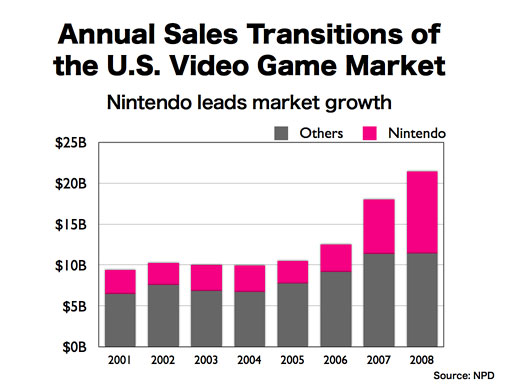
This data shows the breakdown of sales by Nintendo platform, in red, and others. The presence of Nintendo products has rapidly increased in the U.S. video game market. Especially in 2007 and 2008, almost all the market growth was attributed to the growth in product sales for Nintendo platforms. The fact that Nintendo is leading the market growth should be obvious from this graph.
When I showed this graph during my keynote speech at the Game Developers Conference held in March this year in San Francisco, some of the audiences did not realize that the red portion in the graph includes sales of hardware, software and accessories for Nintendo platforms. In other words, this also accounts for third party software sold for Nintendo platforms.
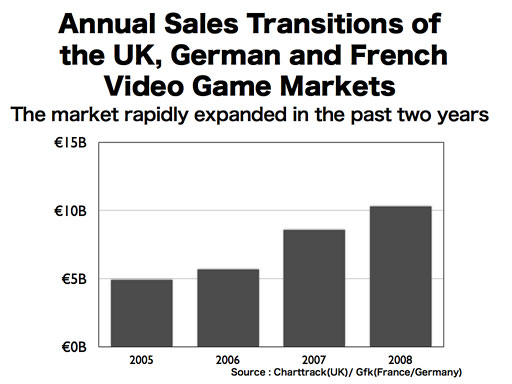
The graph shows the sales transitions of the three biggest video game markets in Europe: the UK, France and Germany. Although we were only able to compile data from the past 4 years, the markets have rapidly expanded in the past two years, similarly to the U.S.
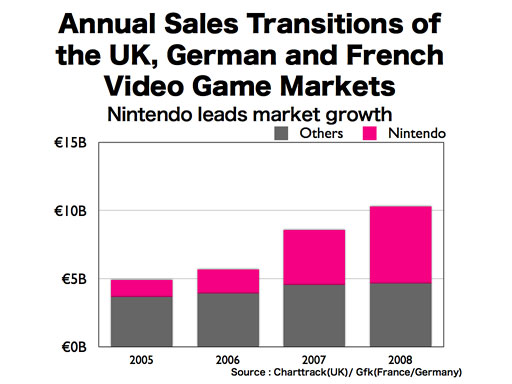
Again, we have broken down the data by sales on Nintendo platforms, in red, and others. The red portion include third parties software sales.
As in the U.S., Nintendo's presence in the market has quickly expanded. The sales share of Nintendo-platform-related products has increased to become approximately 55%, which is bigger than the 47% share in the U.S.

We have never seen the overseas market expansion of this magnitude that we are witnessing now in the U.S. and in Europe. And these data attest to the fact that the growth has been led by Nintendo. As you all well know, Nintendo has been following its strategy of the Gaming Population Expansion. From time to time, we have shown pictures to show that people who had previously never been thought to play video games are now playing with DS and Wii.
Today, from a somewhat different perspective, I'd like to once again explain to you the current status of the Gaming Population Expansion, which has been supporting the video game market growth.